

This is a paper I am excited about. Four years after EA4, we finally have a new Norwegian genome-wide association study of education that lets us test its findings in a largely independent sample. For anyone who has been waiting to see how well the signal holds up in a fresh cohort, this is a welcome development.
The study is Beyond years of schooling, by Eirik Haugland Kvalvik and colleagues. It draws on 120,527 adults from the Norwegian Mother, Father and Child Cohort Study, known as MoBa. And the headline finding is encouraging: the genetic correlation between Norwegian years of education and EA4 is about 0.93, with a 95% confidence interval of 0.90–0.96. The same Norwegian EduYears GWAS also has a substantial genetic correlation with intelligence, about 0.63. Both findings make this study especially interesting. [1, 2]
This is the replication I have been waiting for. A genetic correlation measures how closely the genetic effects line up across the two analyses. Here, the broad association with schooling reappears in a Norwegian cohort with a documented route for potential overlap amounting to only about half of one percent.
Naturally, I wanted to see what would happen when I used the new results to calculate population scores. The Norway EduYears score correlates with EA4 at 0.708 across the 48 population aggregates examined here. That is another encouraging result, although a correlation between calculated scores answers a different question from the paper’s genome-wide genetic correlation.
The paper also lets us go further. It separates finishing high school, reaching a bachelor’s degree and progressing to postgraduate education. Do those scores follow the same pattern? The answer is more complicated, and that makes the study more interesting. Before looking at the plots, two details deserve attention: how independent the sample is, and how much information each score contains.
A fresh sample with very little documented overlap
The new study also changes the national setting. Its discovery sample comes from Norway’s MoBa cohort, whereas EA4 pooled European-ancestry participants across many countries. The full EA4 analysis combined 2,272,216 participants from 23andMe, 441,121 from UK Biobank and 324,162 from the remaining EA3 cohorts. The earlier EA3 cohort table describes 23andMe as primarily US-based; it does not establish the exact national composition of EA4’s much larger 23andMe sample. The other cohorts span the United States, Britain, Australia and numerous European countries, including Iceland, Estonia, the Netherlands, Germany, Sweden and Finland. [2, 3]
For the Norwegian paper’s genetic-correlation comparison, the relevant EA4 results exclude 23andMe. UK Biobank therefore accounts for 441,121 of 765,283 participants—about 57.6%—with the remainder drawn from the international EA3 cohorts. This makes the comparison especially interesting: a Norwegian cohort reproduces much of the signal from a multinational, substantially UK-recruited discovery sample, across a different educational setting. These are recruitment countries and ancestry criteria, rather than a verified breakdown of participants’ citizenship. [1–3]
There is a small qualification to “independent.” EA3’s Supplementary Table 22 lists 622 MoBa participants, and EA4 incorporated that EA3 component. If all 622 also appear in the new Norwegian GWAS, they would account for 622 / 120,527 = 0.516% of its sample. That is a very small documented route for overlap. [2, 3]
The same 622 represent 0.0205% of the full EA4 sample, or 0.0813% of its component excluding 23andMe, which the Norwegian paper uses. We do not have a person-by-person match, so these are potential-overlap figures rather than an exact count, and other unverified overlap cannot be ruled out.
“Nearly independent” is therefore the accurate description. It still gives us an exciting opportunity to test how well the education signal carries over. The paper also includes a separate twin analysis of 8,910 people; those participants are not added to the GWAS discovery sample.
Why some scores have so few SNPs
Table 1 covers EduYears and all eight milestone analyses. Comp means compulsory education or below; HS means high school, BSc bachelor’s degree, and MSc master’s degree. A plus sign includes higher qualifications. An arrow denotes progression among people who reached the preceding milestone; cumulative outcomes compare everyone at or above the threshold with everyone below it. [1]
Table 1. Discovery sample sizes and published lead variants
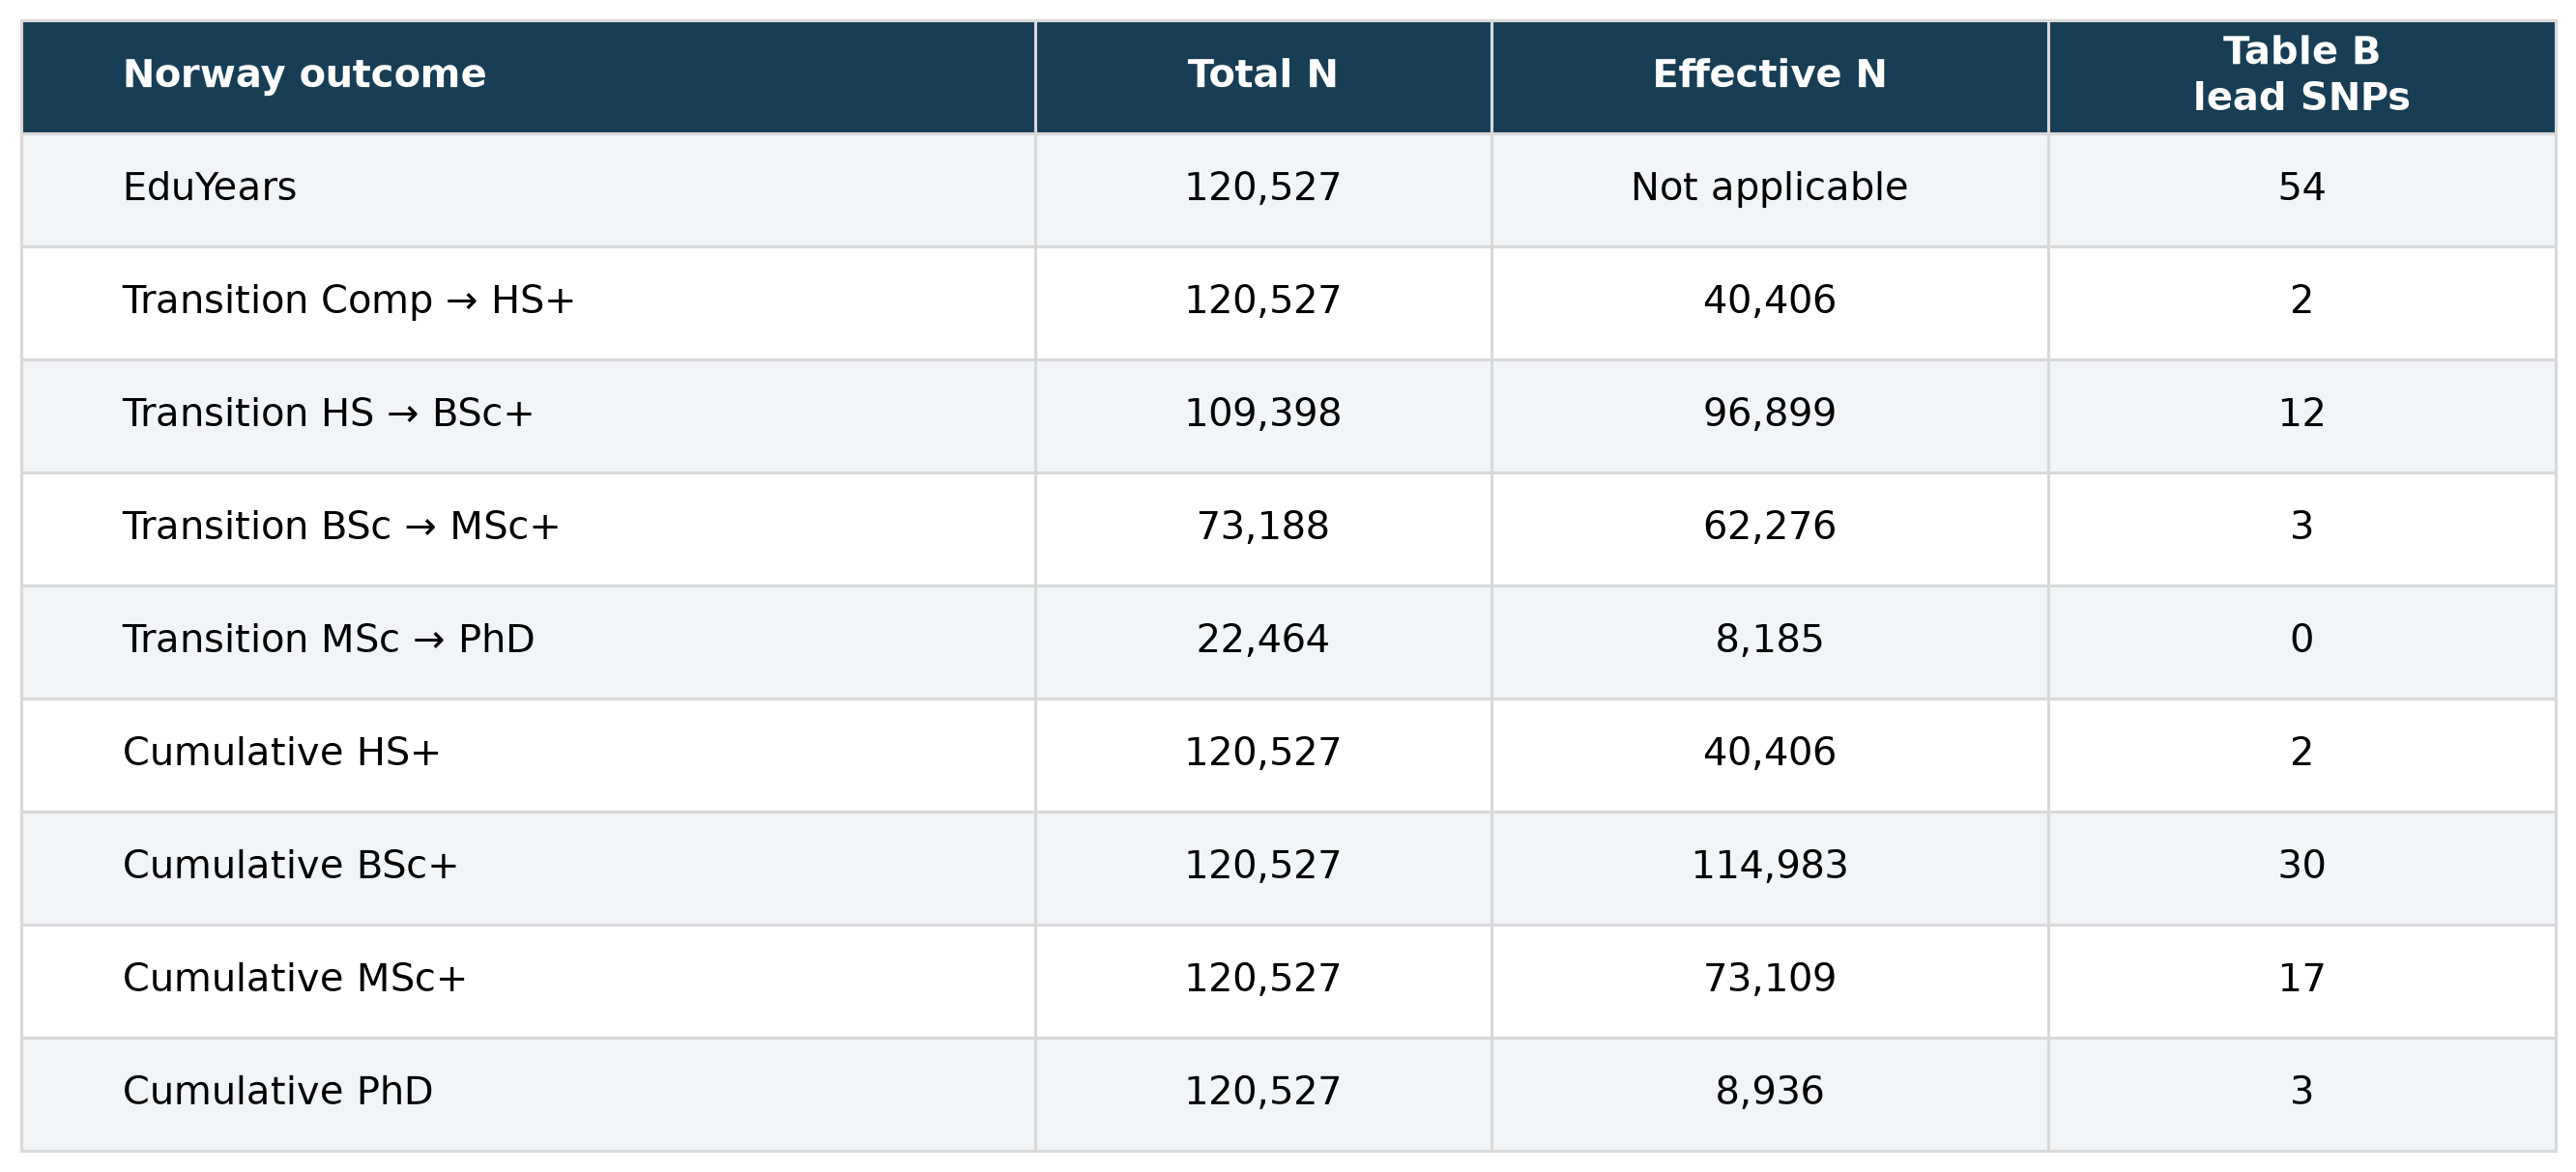
Transition analyses lose participants as the preceding qualification rises. Cumulative analyses keep the full cohort, but unequal case and control counts reduce power. Cumulative PhD, for example, has 120,527 participants but only 2,277 cases, giving an effective N of about 8,936. Fewer true associations can then cross the significance threshold.
Binary outcomes also discard educational detail. Cumulative BSc+ treats bachelor’s, master’s and doctoral holders alike; EduYears distinguishes their qualifications. That can reduce power even when the effective sample size is close to the full cohort. Numbers of discoveries also depend on effect sizes, allele frequencies and the genetic architecture of each outcome.
Small lead-variant panels may represent the genome-wide signal poorly, and selecting significant estimates can exaggerate their effects. Lower power could contribute to the weak correlations, but we have not established how much it explains.
Fewer SNPs do not automatically mean a lower correlation: cumulative MSc+ uses fewer variants than cumulative BSc+ but agrees more closely with EA4 in our plots. The particular loci and their frequency patterns also matter.
The study also recovers the connection with intelligence
There is another result here that deserves attention. The Norwegian years-of-education GWAS has a genetic correlation of about 0.63 with intelligence. For me, this adds to the excitement: the new sample reproduces the familiar connection between the genetic associations with schooling and cognitive ability, alongside its strong agreement with EA4. [1]
Table 2 puts the two comparisons side by side. The intelligence estimates use the external intelligence GWAS by Savage and colleagues (2018). These are genome-wide genetic correlations, distinct from both our population-score correlations and individual prediction of measured IQ. [1, 4]
Table 2. Genetic correlations with EA4 and intelligence reported in the Norwegian study
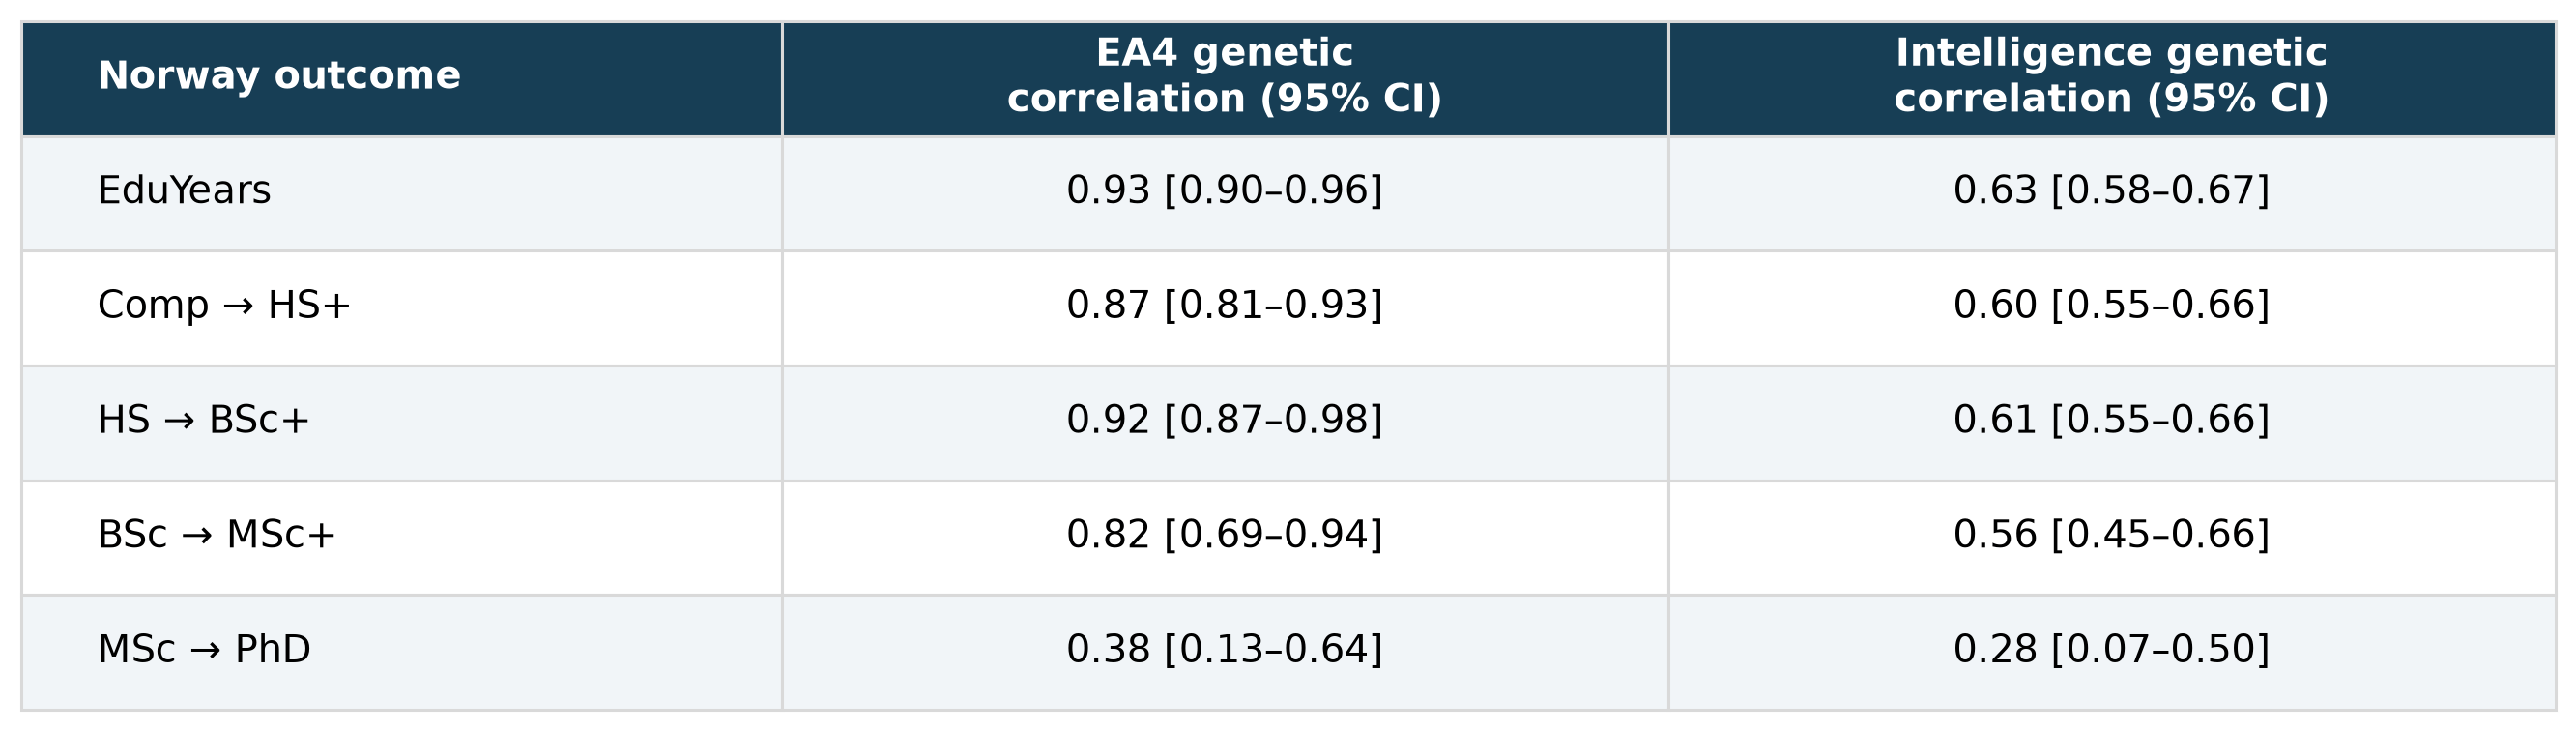
The connection with intelligence is substantial for finishing high school and reaching a bachelor’s degree, at around 0.60–0.61. It remains substantial for progression from bachelor’s to master’s, at about 0.56. The clearest drop appears at the final transition to a doctorate, where the estimate is 0.28 and the confidence interval is much wider.
That final comparison concerns only people who have already reached at least a master’s degree. Selection into that group may reduce the remaining variation in education-related characteristics. The doctoral analysis is also much smaller. The authors therefore caution against reading the lower correlation as evidence that intelligence matters little for completing a PhD.
The paper checked the pattern against a second intelligence GWAS, by Lam and colleagues (2021), and found a similar trajectory. Under that sensitivity reference, the intelligence-correlation differences between the doctoral transition and each of the three earlier transitions remained significant after correction for multiple comparisons, at q < 0.01. [1, 5]
These findings strengthen the case that the new GWAS captures an established component of educational attainment. They also help explain why separating educational stages is worthwhile: a single years-of-schooling measure cannot show how the pattern changes among people who have already passed successive educational thresholds.
The 0.63 estimate describes shared genetic association, not the percentage of education caused by intelligence. The encouraging finding is that this relationship reappears in the Norwegian results.
The overall agreement with EA4 hides a striking reversal: East Asian populations move ahead of Europeans under the Norwegian EduYears score. Below, paid subscribers can explore the full correlation matrix and labeled scatterplots, including where the milestone scores agree—and where they diverge.
