Did Covid vaccines reduce fertility? Comparing uptake across age groups
What changes when I compare reproductive-age uptake with vaccination at other ages?

Fertility was falling in many countries before Covid, and the decline continued after the pandemic began. Between 2019 and 2024, Japan’s total fertility rate fell from 1.36 to 1.15 births per woman, and South Korea’s from 0.92 to 0.75. China’s survey-based total fertility rate was about 1.14 births per woman for the period 1 November 2023–31 October 2024.
The path has not been uniform. South Korea’s fertility rate and China’s survey-based TFR both rose between 2023 and 2024. In the EU, fertility fell from 1.38 to 1.34 births per woman over the same year, the lowest value in Eurostat’s series since 2001. The longer declines across Europe and East Asia have prompted a search for explanations. One of the most contentious is Covid vaccination.
The question is understandable given the timing. Mass vaccination was followed by lower fertility in many countries. But the same period brought infection waves, restrictions, disrupted relationships and economic uncertainty. It’s a challenge to isolate what vaccination itself might have contributed.
A country with high vaccine uptake among prospective parents usually also has high uptake among older adults. That gives me a useful comparison: among countries with similar vaccination rates at older ages, does uptake at ages 18–49 predict a different fertility trajectory?
I began with a broad comparison of 90 countries and territories. The more detailed age records let me examine this question in 28 European countries, and then add Canada, the USA and Malaysia. Comparing uptake at different ages changes the picture considerably.
Comparing uptake at different ages
I compared vaccination uptake in 2022 with observed fertility in 2024, using the total fertility rate (TFR), measured in births per woman. Choosing 2024 allows time for vaccination to precede conception and the following nine months of pregnancy.
I asked whether higher coverage at ages 18–49 predicted a larger fertility change from 2019 to 2024 after accounting for coverage at ages 50+, country differences, regional shocks and pre-pandemic economic and demographic conditions. Annual records from 2010 onwards let me check the earlier paths too.
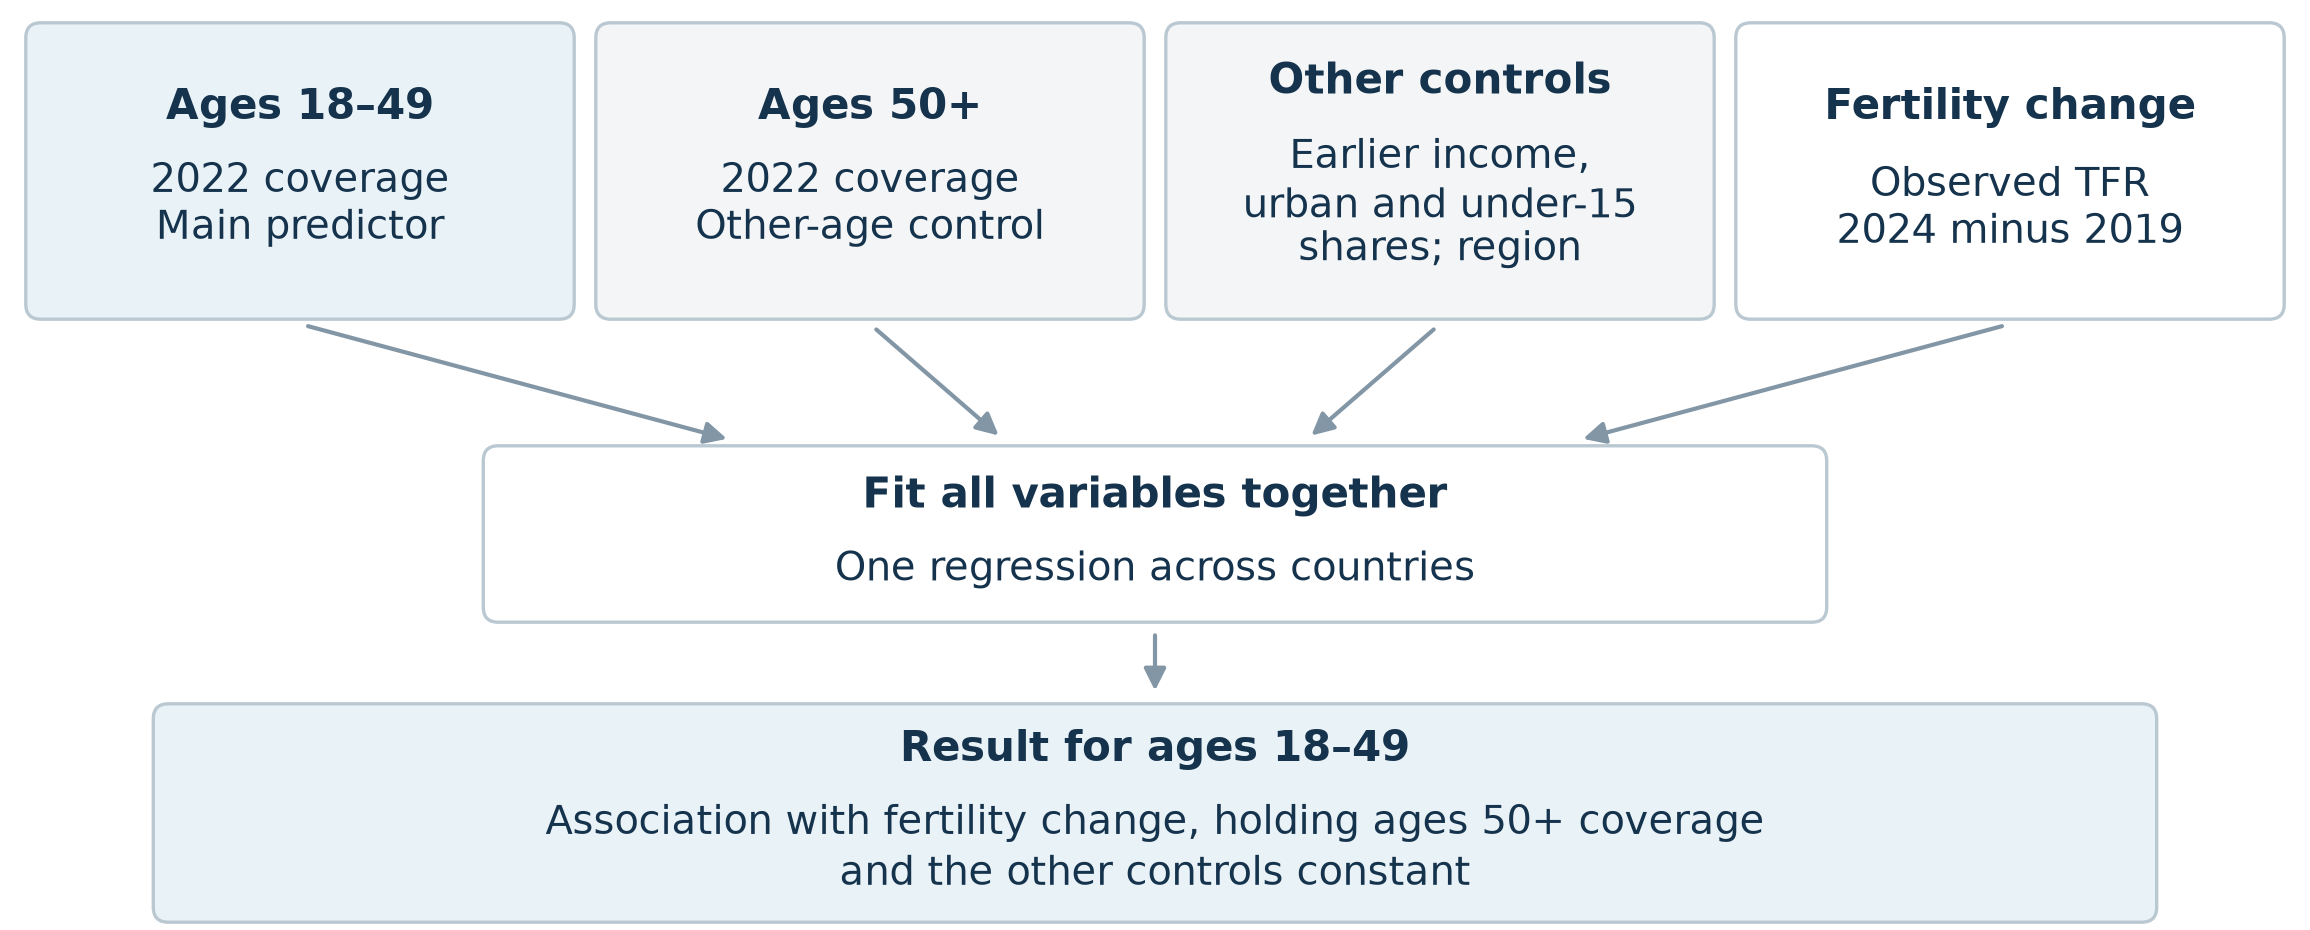
I fitted coverage at ages 18–49, coverage at ages 50+ and the other controls together in one regression. The coefficient for ages 18–49 asks whether fertility changed more in countries with higher uptake at those ages, holding the other variables constant (Figure 1). Both vaccination age groups include men and women.
Figure 1. What the main model compares
Reproductive-age uptake predicts a larger fertility decline
Across 31 countries, higher vaccine coverage at ages 18–49 predicts a larger fertility decline after I account for vaccination among older adults. The estimate is −0.065 births per woman per ten percentage points vaccinated. Its nonspatial, country-clustered 95% confidence interval is −0.119 to −0.011, with p = 0.021 (Table 1).
The estimate is also significant with the wild-cluster bootstrap, p = 0.023. That calculation repeatedly reweights countries while preserving each country’s time series. For scale, 0.065 births per woman is about 4.3% of a hypothetical TFR of 1.50, for a ten-percentage-point difference in reproductive-age coverage.
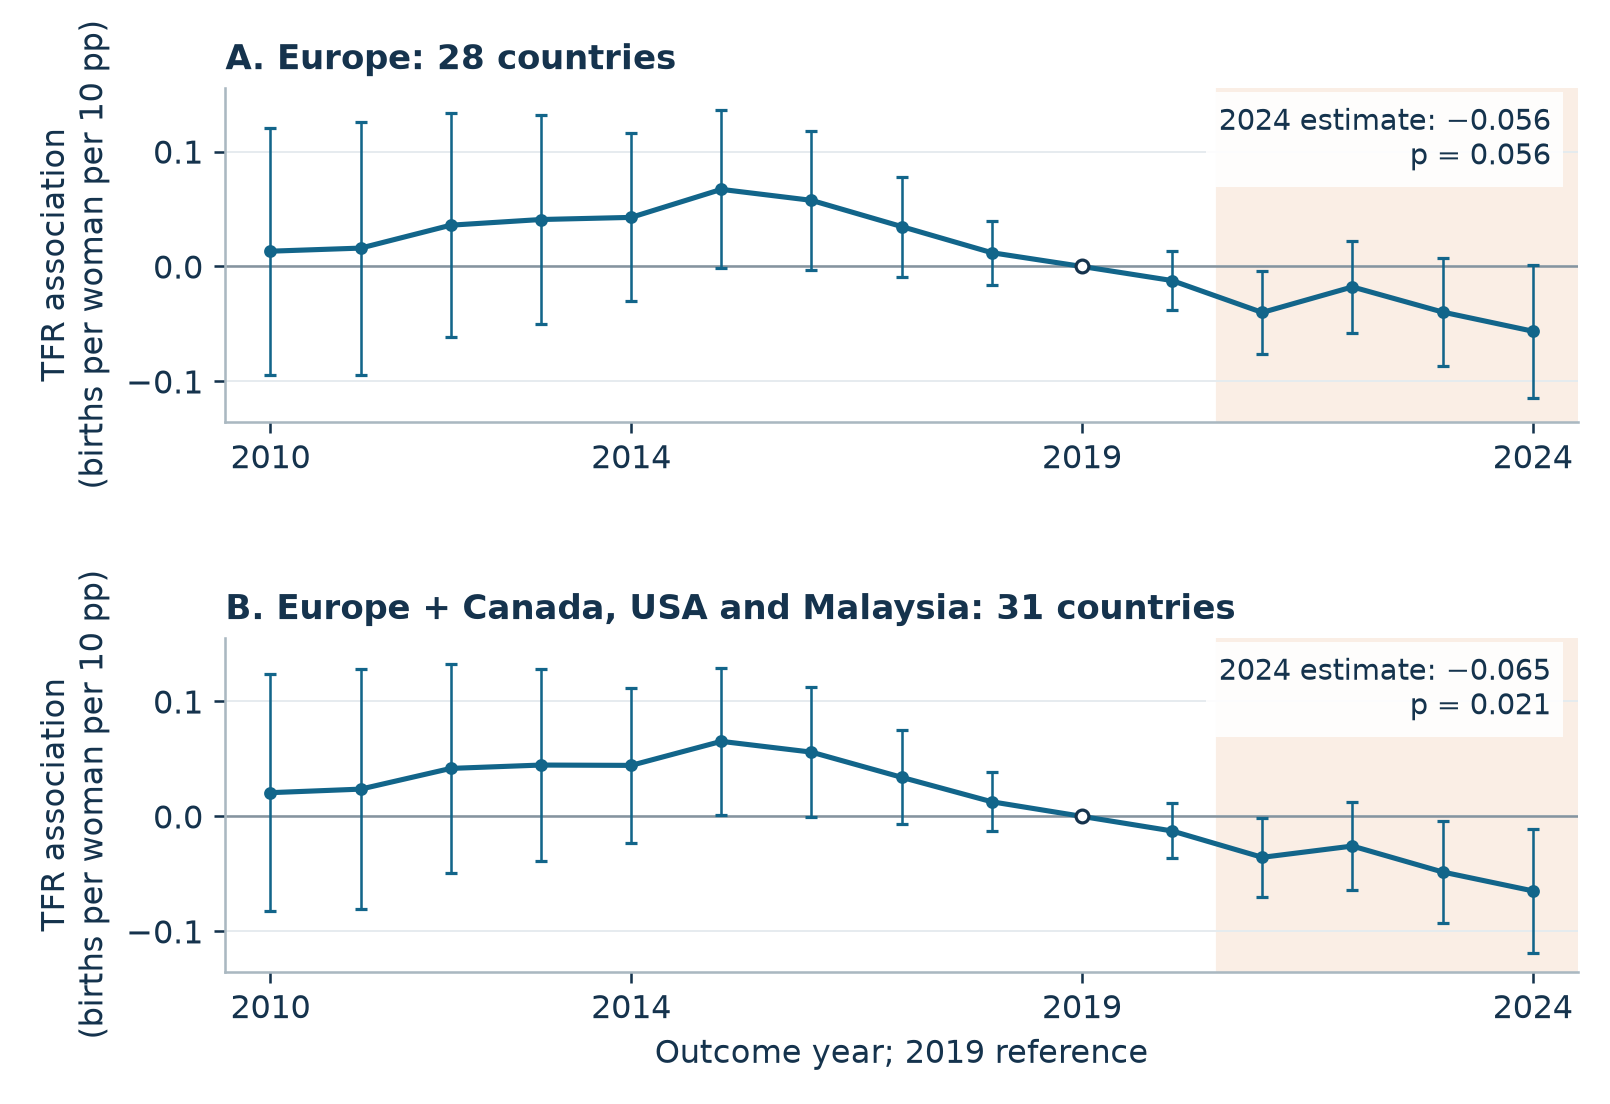
Europe alone points in the same direction. Across 28 European countries, the annual coefficient is −0.056 after controlling coverage at ages 50+. Its interval extends just above zero, −0.114 to +0.002, with p = 0.056. Figure 2 shows the annual paths with older-age uptake controlled throughout.
Table 1. Fertility change and reproductive-age uptake after controlling other ages
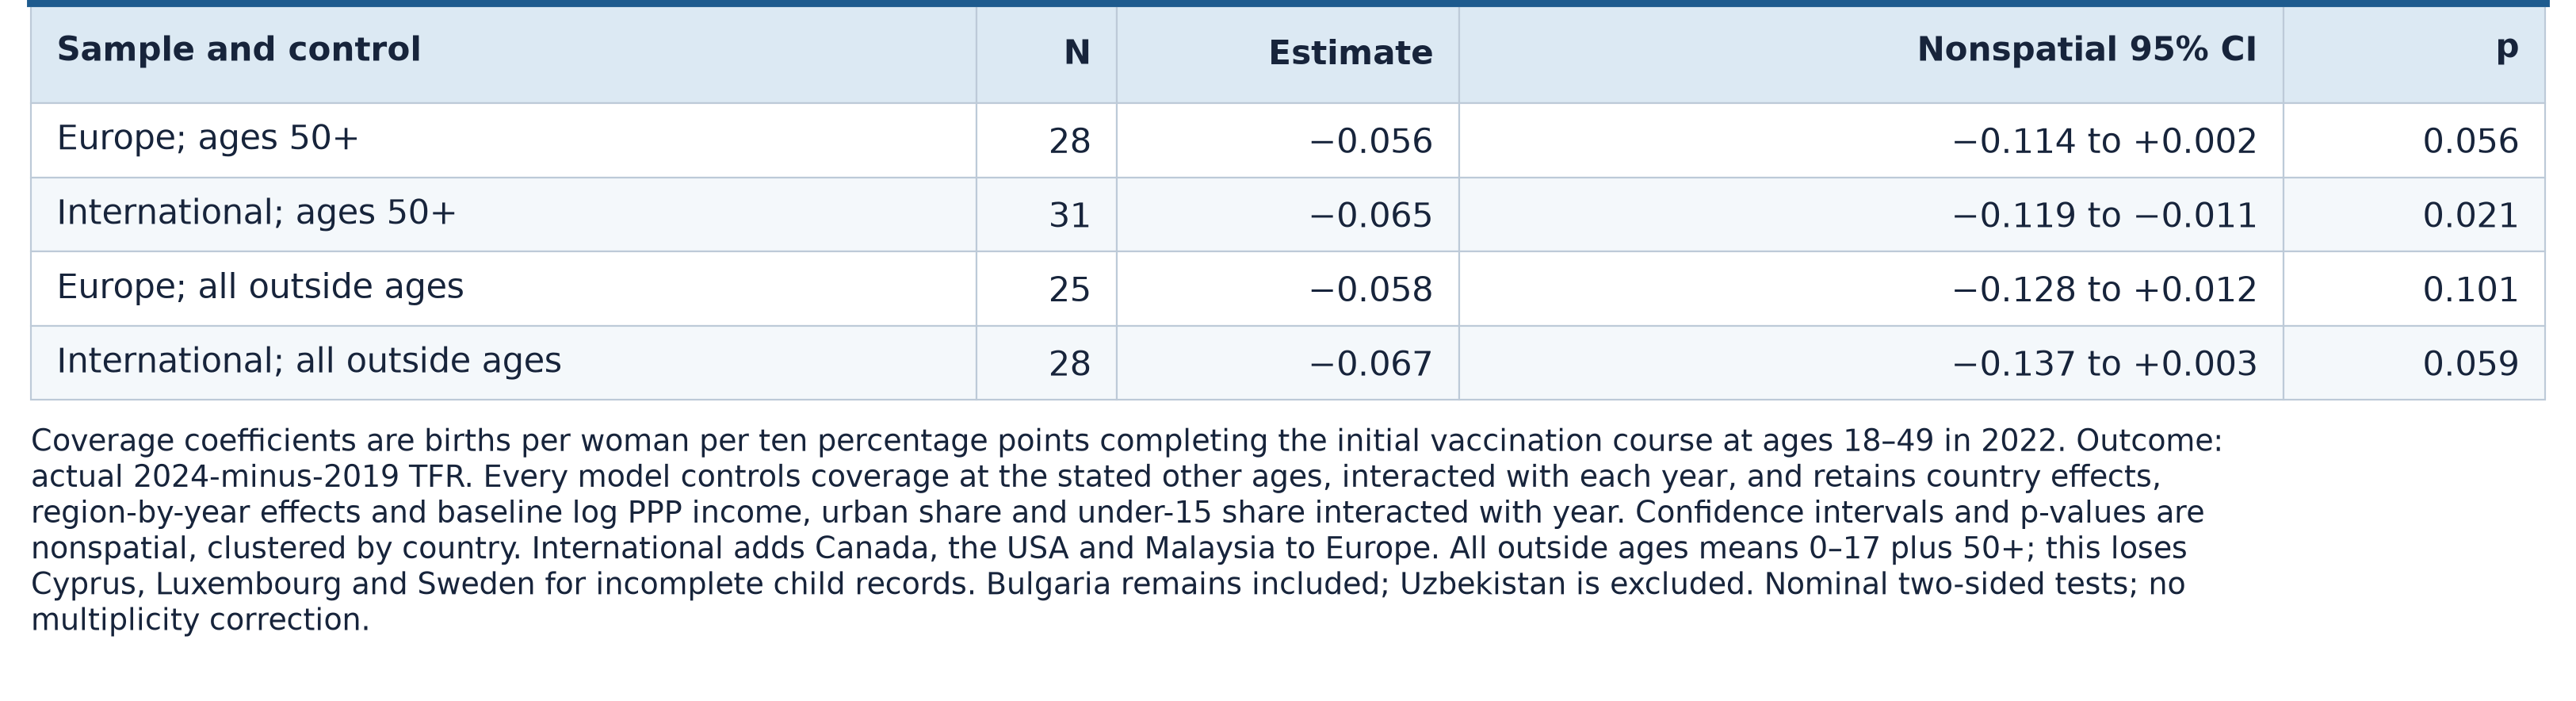
Figure 2. Fertility trajectories after controlling older-age uptake
The comparison asks whether reproductive-age coverage predicts fertility among countries with similar older-adult uptake and other measured characteristics. Uptake in the two age groups is strongly correlated, so this leaves less variation to work with. I show the models without other-age uptake in the appendix.