Did Europe Catch Up With Republican Rome?
Ancient DNA from Central Italy and its European contemporaries

Augustus recalled sending a fleet from the mouth of the Rhine as far as the lands of the Cimbri. In the same account he ran through Gaul, Spain and the Alps, measuring his achievements by how far Rome’s reach had extended. I’m interested in a different comparison. How did the people who lived around Rome during the Republic compare with people across that wider map? And when the difference narrowed, which side changed? Augustus, Res Gestae 26
In my earlier post I compared Italy with northern Europe. Here I use Central Italy as my proxy for Rome and widen the comparison to Britain and Ireland, Continental Europe, Scandinavia and Iberia. I also include Southern Italy and Sicily so we can see how the region around Rome compared with its neighbours closer to home. I use the dates of the Republic as the same benchmark in every region. Rome and the Northern Catch-Up: Direct Genetic Effects, Harder Answers
I compare two genetic scores associated with years of education today. One uses effects estimated by comparing relatives, so I call it within-family EA. The other, EA4, uses associations across the general population. I also include a score for fluid intelligence, or FI. These are genetic scores constructed from modern studies, so what I can follow through time is how the scores change across the ancient burials. Tan et al. 2024 · Okbay et al. 2022 · van den Berg et al. 2026
Ancient genomes vary widely in how confidently we can recover the variants that enter a score. For this comparison I keep genomes that pass a high-confidence cutoff for the variants used in each score. That choice matters especially when I ask what happened in the centuries after the Empire.
Where the Republican lead extended
On within-family EA, Central Italy scores higher than each comparison during the Republic in Figure 1. The gaps with Britain and Ireland and with Continental Europe are about half a standard deviation. Iberia gives the largest estimate (+0.67), though the comparison rests on 17 Iberian genomes. Southern Italy, whose Republican burials in this sample come from Sicily, is closer to Central Italy. Table 1 shows how much uncertainty there is in each comparison.
Figure 1. Within-family EA in Central Italy and five comparison regions
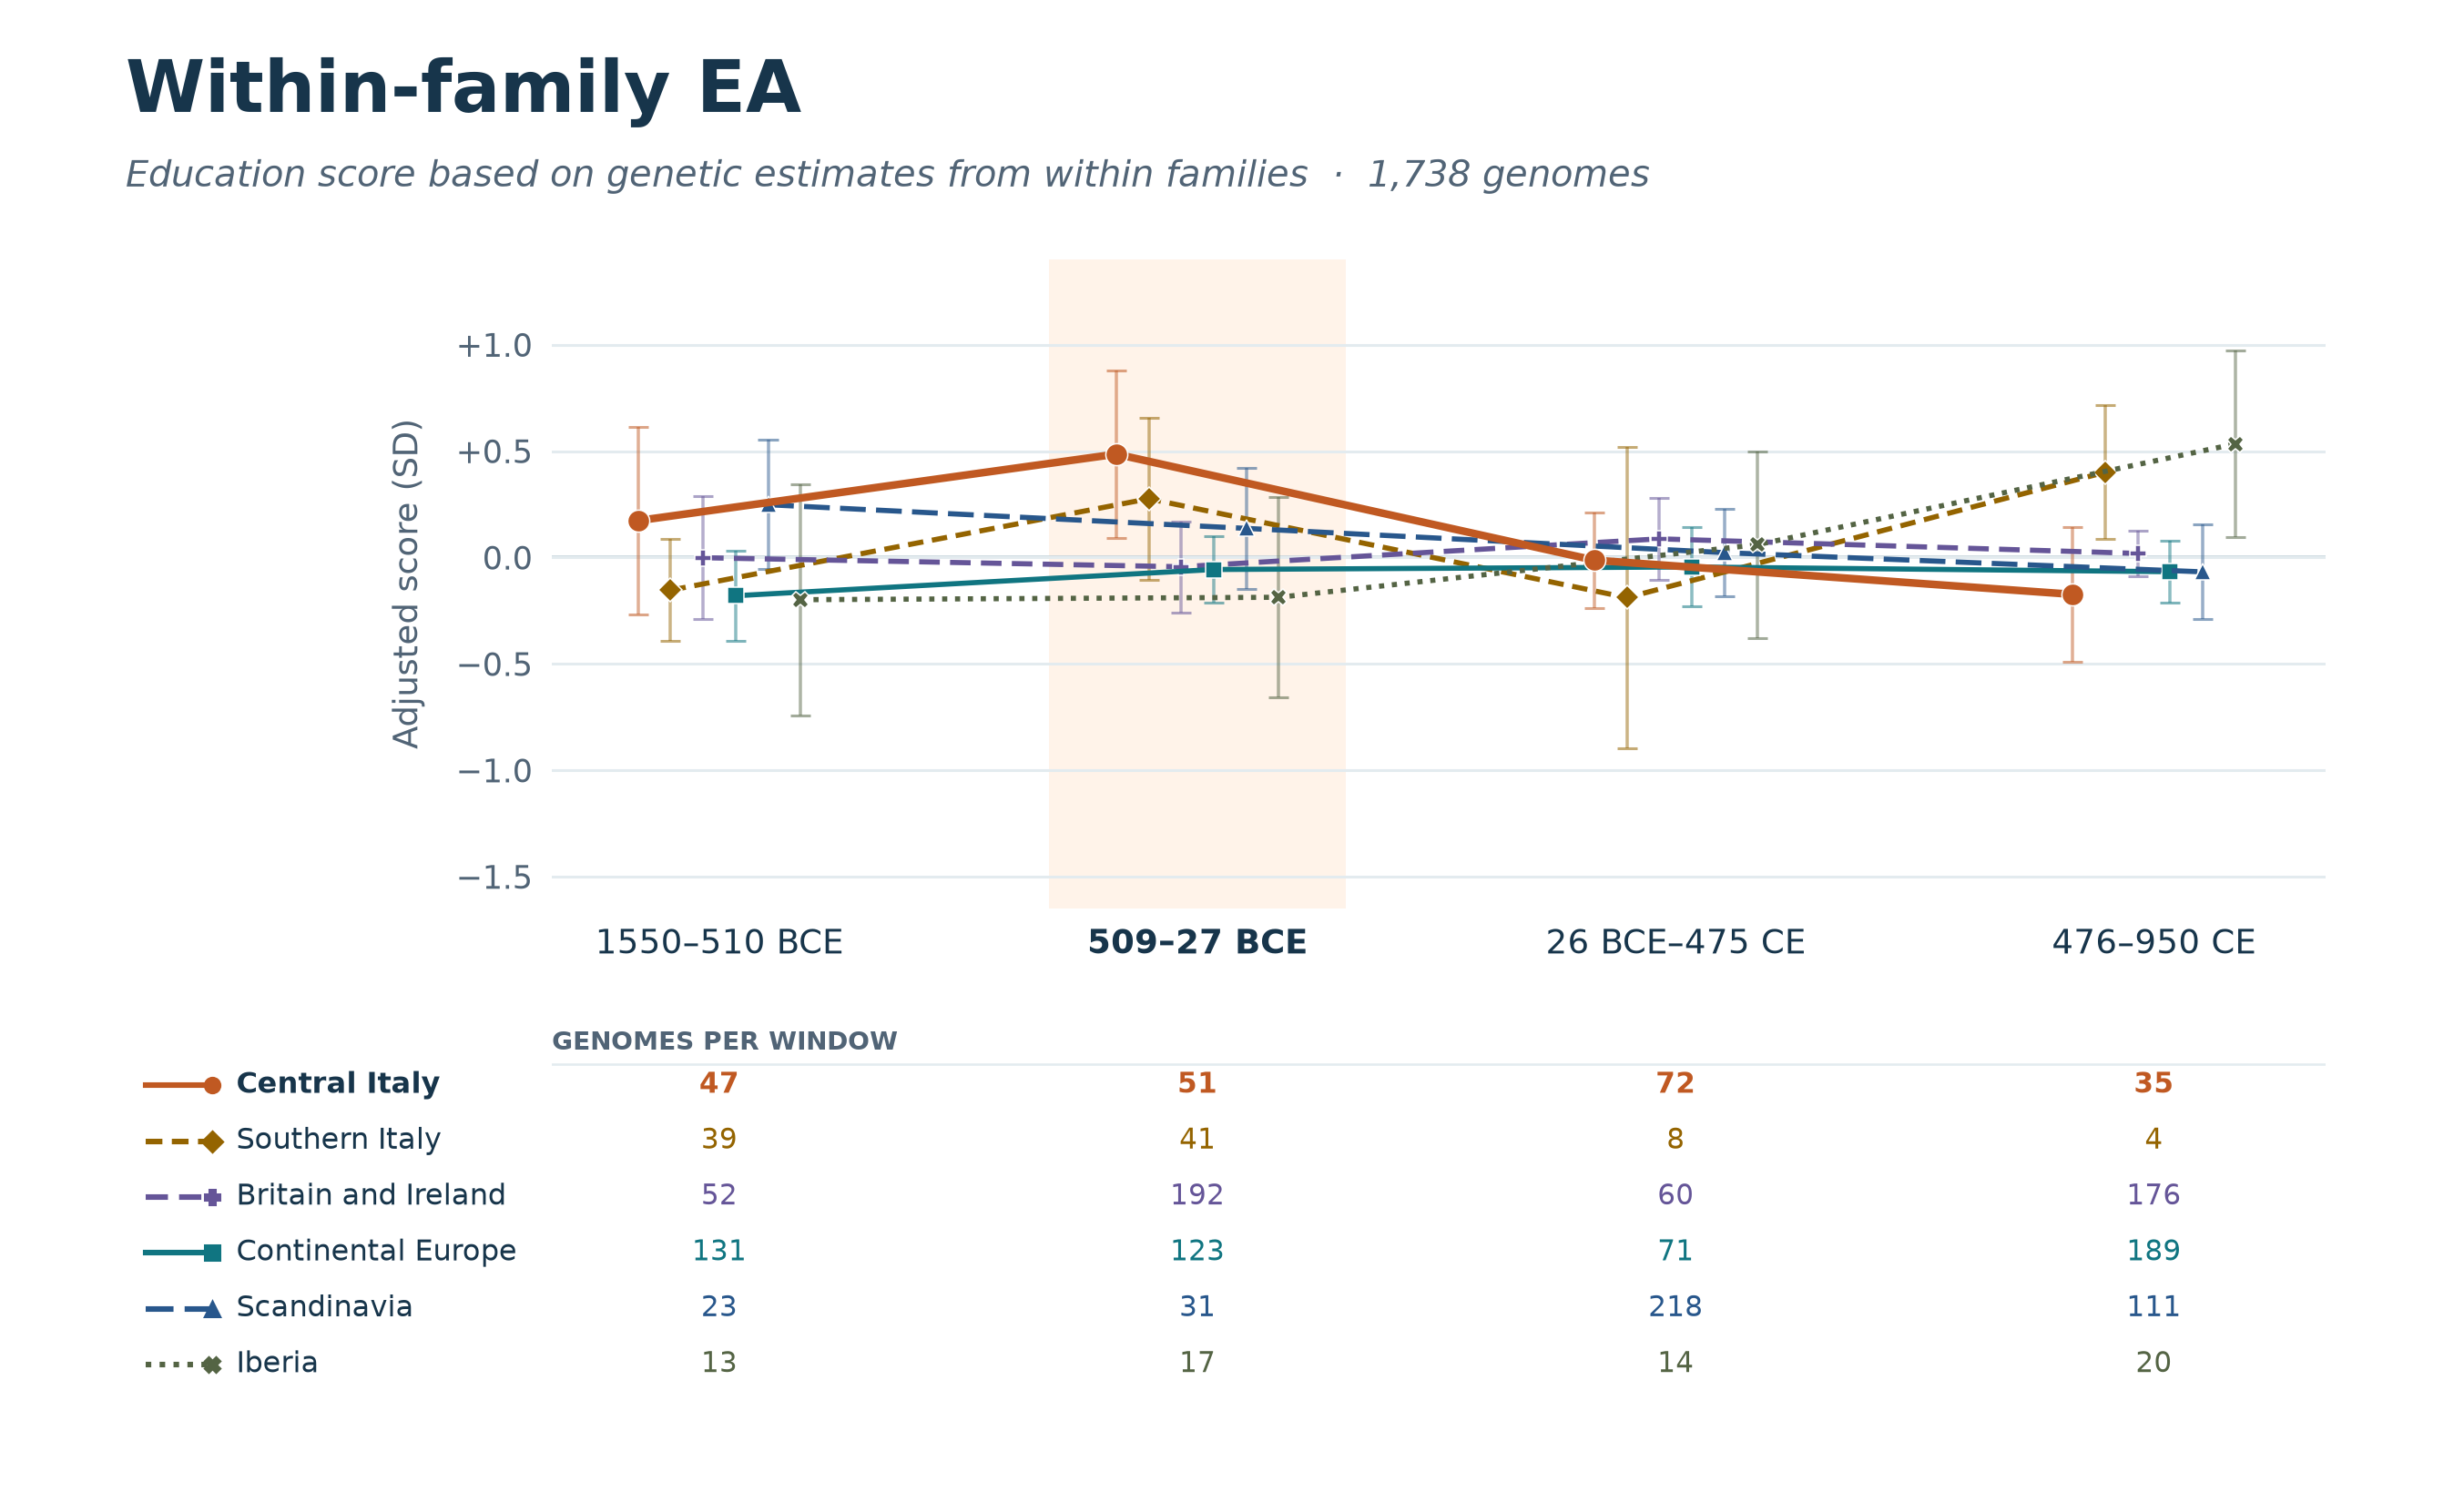
Pooling the four regions outside Italy gives Central Italy a lead of 0.52 standard deviations. That gap is close to zero in the Imperial period. In the pooled comparison, Central Italy falls by 0.51 standard deviations while the comparison sample changes by only +0.04. Iberia is a different case. By 476–950 CE its within-family score rises by an estimated 0.72 standard deviations from its own Republican level. That comparison draws on 17 earlier genomes and 20 later ones.
What changes on the second education score
EA4 also puts Republican Central Italy ahead, by 0.46 standard deviations over the rest of Europe. The geography looks different. In Figure 2 the largest Republican gap is with the southern sample (0.71), the closest comparison on within-family EA. The two scores broadly agree on Rome’s position among its contemporaries and give different rankings of the individual regions. Table 2 has the full comparisons.
Figure 2. EA4 in Central Italy and five comparison regions
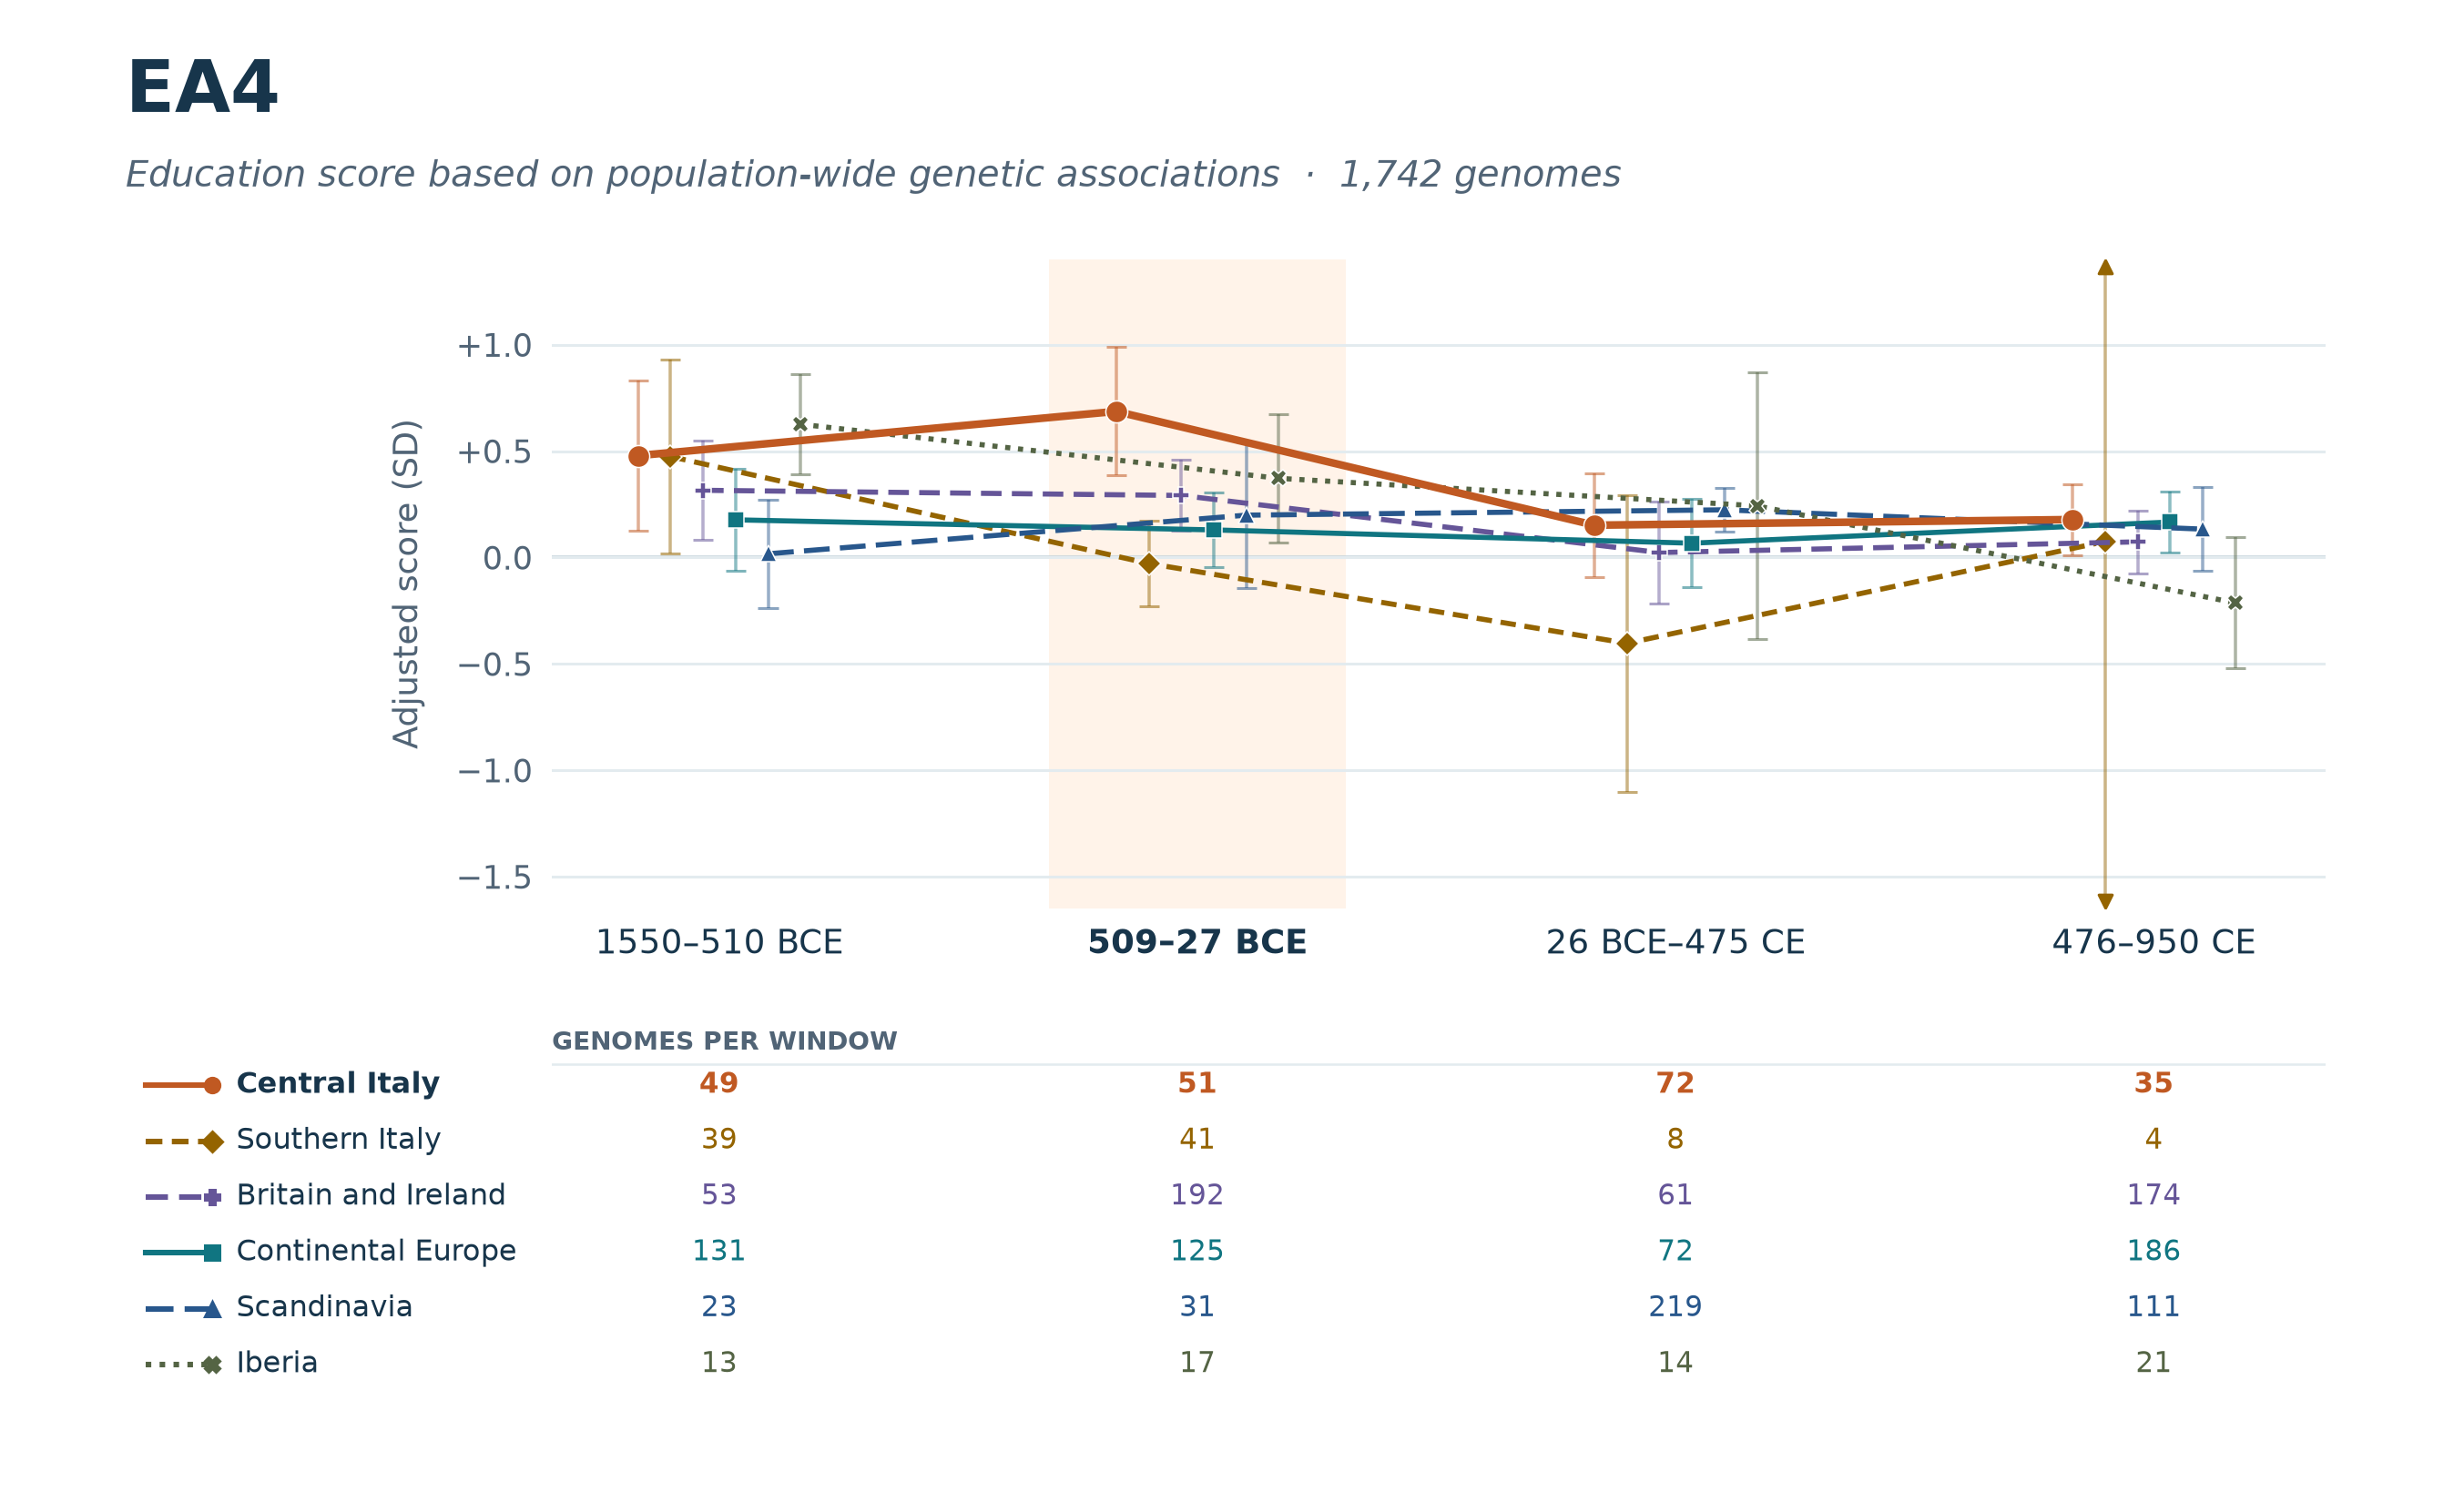
On EA4, Central Italy drops by 0.52 standard deviations from the Republic to the Empire in the pooled model, and the four regions outside Italy together shift by −0.05. The two education scores tell much the same story about where the narrowing came from. Their agreement makes the next question more interesting. Did the same thing cause both declines?
Upgrade to see whether Rome’s genetic scores kept falling after the Empire, how much of the decline came with the shift toward eastern Mediterranean ancestry, and which score still fell after I held ancestry constant. You’ll also get the full regional comparisons for all three scores.
