

When we meet someone unusually tall or short, we often ask whether it runs in the family. That question is much harder to answer for a person who lived thousands of years ago. There are no parents to meet and no childhood photographs. There may be a femur, an archaeological report and, if we are lucky, enough surviving DNA to work with.
The bones give us an estimate of how tall that person became. They leave another question open: why that height? Inherited differences matter, alongside the conditions in which a child grows up. Ancient DNA gives us a way to bring those two kinds of evidence together.
Can a genetic score developed from people alive today still tell us something about stature in the distant past? A height polygenic score (PGS) is a weighted tally of height-associated variants. A common criticism of ancient-DNA time series is that we cannot assume these modern scores work equally well in past populations. Genetic backgrounds have changed, and so have the environments in which children grew up. Earlier studies have compared scores with skeletal stature, giving us a way to test that criticism against the bones themselves. How far does the relationship travel across European prehistory? [1,3]
The expectation is simple: people with higher polygenic scores should tend to have longer skeletons. But does that hold when we compare women with women, men with men, and people from different periods and genetic backgrounds? If it does, a second set of questions opens up. Do the scores and the bones tell a similar geographical story? And when we look through time, do genetic predictions and physical stature move together?
Can a modern score reach into the past?
To bring those questions down to earth, I matched published skeletal measurements to ancient genomes. The comparison brings together 459 people with both a stature estimate and a height polygenic score, drawing on the compilations of Cox and colleagues and Marciniak and colleagues, alongside additional measurements from the original studies. The genetic weights come from the modern height study of Yengo and colleagues. [1–6]
The crucial test is whether the genetic ranking has a physical counterpart. Men being taller than women would tell us little about the score. Nor would a comparison that simply put people from one study against people from another. The useful question is whether the score still distinguishes stature after allowing for those differences and for the dates of the remains.
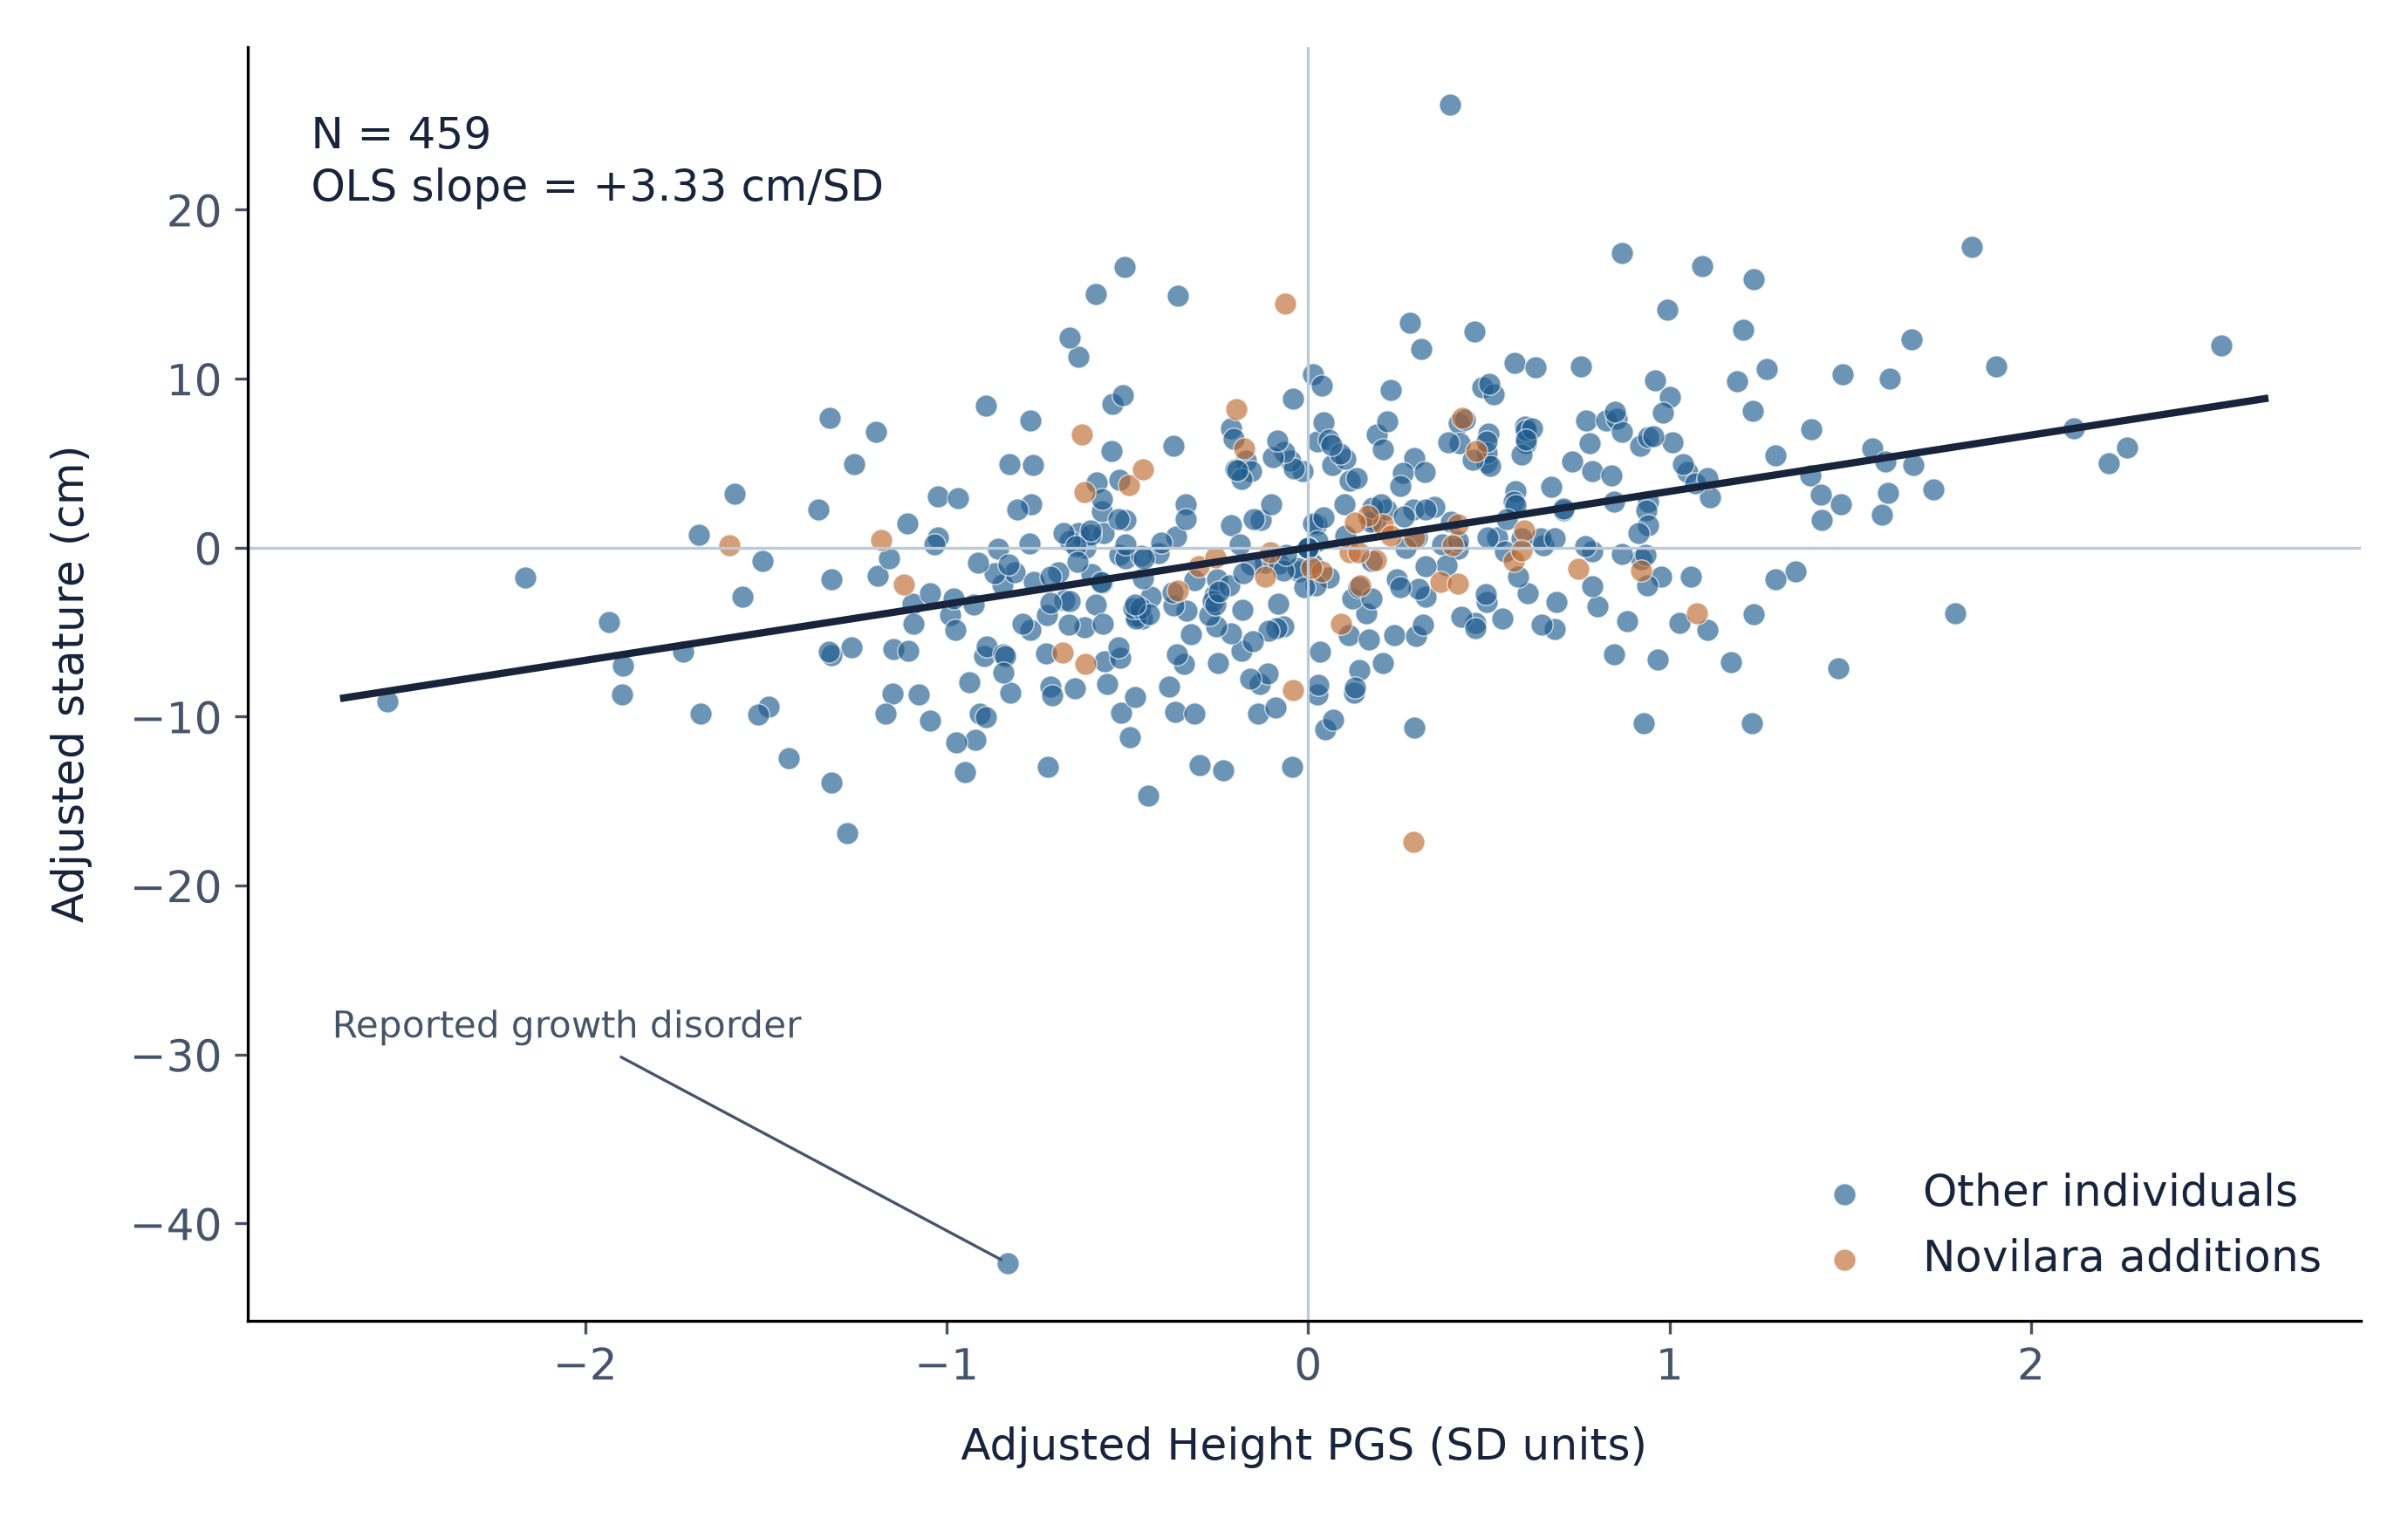
Figure 1 shows that height polygenic scores positively predict skeletal stature in this ancient sample. After accounting for sex, date, study and imputation uncertainty, a difference of one score standard deviation corresponds to about 3.3 cm of stature. That is large enough to be physically meaningful, even though the scatter around the line is substantial. Table 1 gives the estimates and their uncertainty.
Could the relationship mainly reflect differences in ancestry? To probe that, I used a genetic relationship matrix (GRM), which allows genetically similar people to share residual variation. The estimated stature difference stays close to 3.1 cm per score standard deviation (Table 1). The positive coefficient is therefore robust to this ancestry-conditional specification.
Figure 1. Height polygenic scores and skeletal stature
Upgrade to see whether height polygenic scores and skeletal stature rose together over the last 10,000 years, compare women and men across Europe, and discover which patterns survive adjustment for genomic similarity.