

In 9 CE, Augustus had Rome’s knights divided into two groups: married men on one side of the Forum, unmarried men on the other. The married group was much smaller. The knights were pressing him to scrap his marriage laws. According to Cassius Dio, Augustus praised those who had married and then turned on the bachelors, accusing them of letting their families die out. Cassius Dio 56.1–10

Rome was drawing people from across the Mediterranean while its ruler worried about the next generation of Roman families. Immigration changes who joins a population. Differences in family size change whose genes reach the next generation.
In Rome and the Northern Catch-Up Reanalysed, I reported a fall in education-associated genetic scores from the Republic to the Empire. Immigration looks like an obvious explanation. But in the north-central Italian sample, the fluid-intelligence score falls further when I hold broad ancestry constant. That raises a different possibility: people with higher scores may have left fewer surviving children.
Who was coming to Rome
The ancestry change is well established. Margaret Antonio and colleagues found a marked shift towards eastern Mediterranean and Near Eastern genetic affinities among Imperial-period people buried in and around Rome. Comparisons implicate a broad region including Anatolia, Cyprus and the Levant, alongside other contributions such as North Africa. The genetic mixture was too complex for a single robust two-source explanation. Antonio et al. 2019
These are clues about connections across the Mediterranean. A person whose ancestors resembled an Anatolian reference population might have been born in Rome, descended from migrants several generations earlier, or arrived through another port.
The transformation also extended beyond the capital. Cosimo Posth and colleagues documented an Imperial-period influx of eastern Mediterranean ancestry in their Etruscan-region time series. Together, these studies place Rome’s transformation within a wider movement of people into central Italy. Their cemetery samples still represent particular communities and burial practices. Posth et al. 2021
The slave trade offers a concrete route
Strabo describes a recognisable chain: piracy around Cilicia, on the southern coast of modern Turkey; captives traded through the Aegean island of Delos; and Roman demand for enslaved labour. His account connects the growth of this business to Roman wealth after the destruction of Carthage and Corinth. Here is an actual route by which people from the eastern Mediterranean could reach Roman households and estates. Strabo 14.5.2
Slavery therefore belongs in the ancestry story. So do free migration and the later descendants of migrants. Walter Scheidel’s reconstruction of slave mobility in Roman Italy illustrates both the scale of forced movement and the uncertainty surrounding its demographic accounting. Enslaved people also had children, and manumission could change a family’s legal position without changing its ancestry. Scheidel 2005
Strabo’s slave-trade story belongs substantially to the late Republic. Overseas movement did not begin when Augustus acquired power in 27 BCE. Nor can the genomes tell us what fraction of the Imperial ancestry shift came through enslavement rather than free movement. Assigning every eastern-affinity burial to a foreign slave would go far beyond the evidence.
The three scores tell different stories
A polygenic score adds up genetic variants using weights estimated in modern association studies. I compare three panels: within-family educational-attainment effects from Tan and colleagues, EA4 educational-attainment effects from Okbay and colleagues, and fluid-intelligence effects from van den Berg and colleagues. These scores concern related outcomes, but each has a different discovery design and reference scale. Tan et al. 2024; Okbay et al. 2022; van den Berg et al. 2026
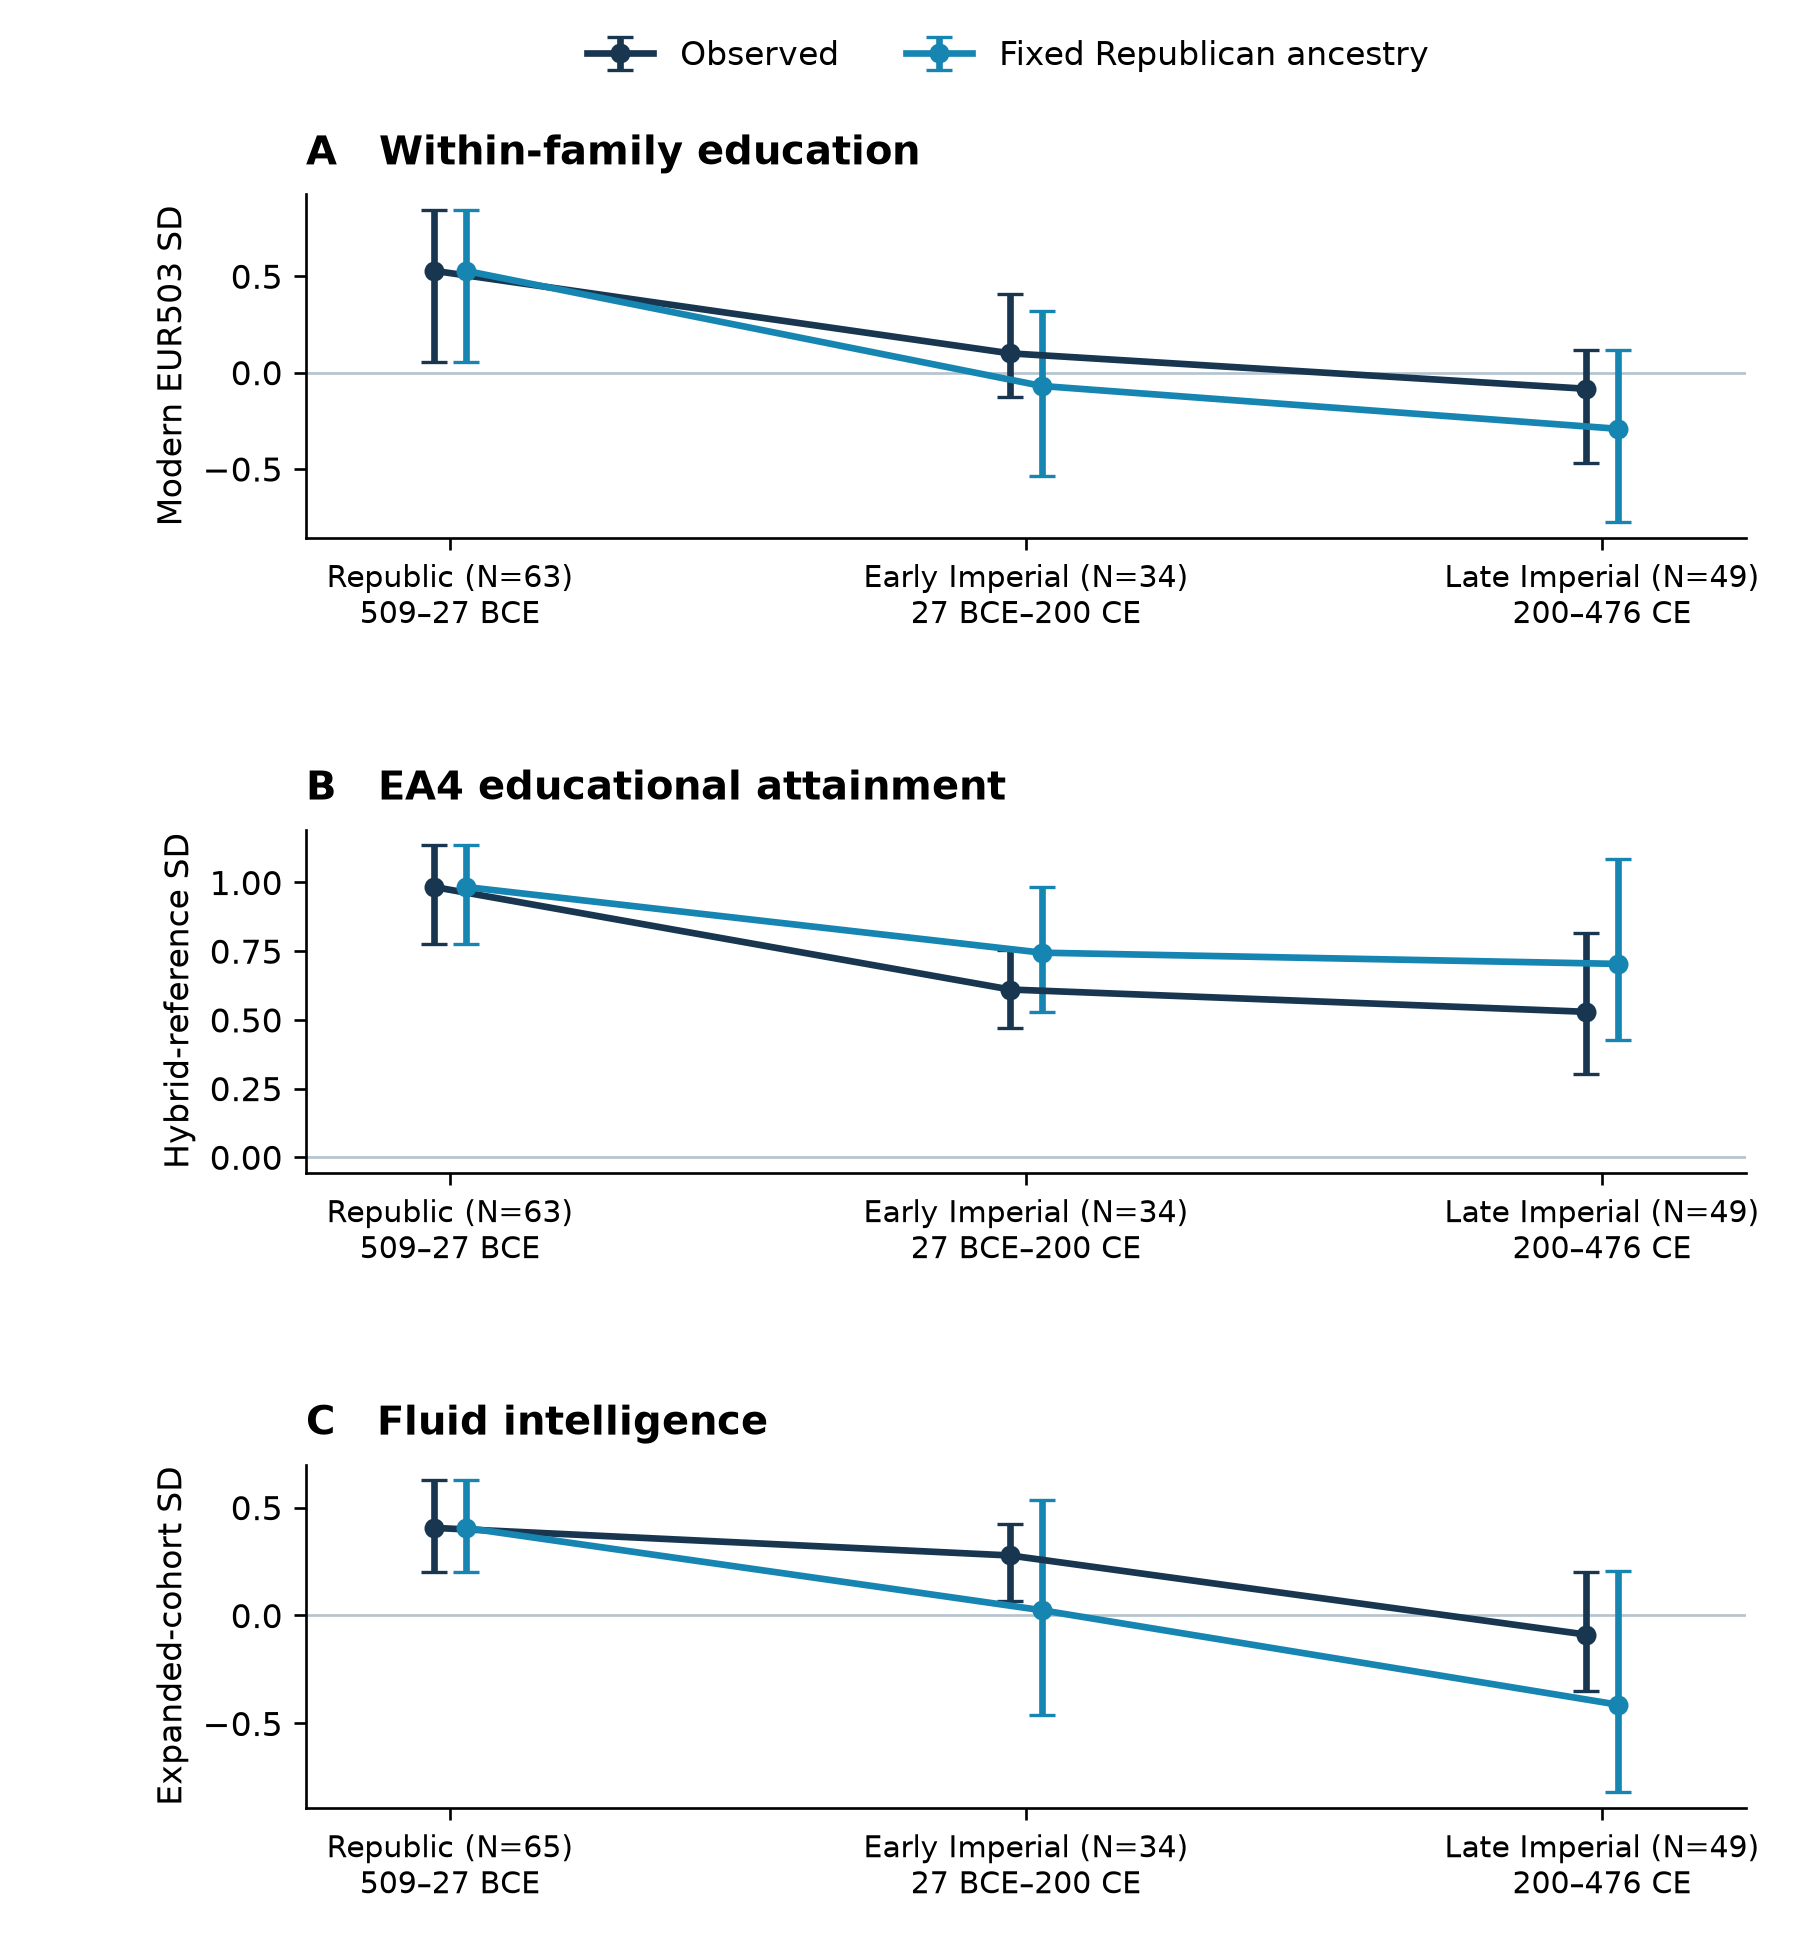
The primary comparison covers burials north of 41.5°N, from the Republic, 509–27 BCE, and the Imperial and late antique period, 27 BCE–476 CE. The education analyses contain 146 people: 63 Republican and 83 Imperial. Fluid intelligence has 148: 65 Republican and 83 Imperial. Each score uses its own quality filter; the two additional fluid-intelligence records are retained.
Figure 1 contrasts the observed trajectory with a fitted counterfactual that holds the Republican ancestry distribution constant while allowing burial geography to change. For fluid intelligence, the pooled observed change is −0.344 score SD, with a 95% site-bootstrap interval of −0.671 to −0.043. The fixed-ancestry change is −0.635 SD, with an interval of −1.174 to −0.045. These pooled estimates compare the Republic with the entire Imperial sample; the figure divides the latter into early and late periods.
Figure 1. Observed and fixed ancestry trajectories across three scores
Immigration looks like the obvious culprit. Yet hold ancestry constant, and two of the three scores fall further, even within Lazio. Upgrade to see the full breakdown and investigate whether elite childlessness and Rome’s grain dole changed who left descendants.