In The Four Races of Europe (Part I), I described a puzzle: northern Europeans are generally fair-skinned and carry more Western Steppe Herder (WSH) ancestry than southern Europeans, yet the Yamnaya pastoralists whose genomes help define that ancestry were usually not predicted to be pale. Among 19 Russian Yamnaya analysed by Lazaridis and colleagues, 13 were predicted to have intermediate complexions, four dark and two dark-to-black; none was classified pale. Here, “dark” means darker than fair-skinned present-day northern Europeans on that published prediction scale. Ancient appearance remains uncertain because these are genetic predictions.
Descendants inherit recombined chromosomes from steppe migrants, earlier European farmers and hunter-gatherers. Pigmentation alleles can change frequency within each inherited background. Irving-Pease and colleagues traced allele-frequency histories in several ancient source lineages; they did not estimate a single WSH-specific trajectory. I ask where change occurred using the Skin587 score from my earlier skin-colour analysis, blue-eye alleles and a blonde-hair association score.
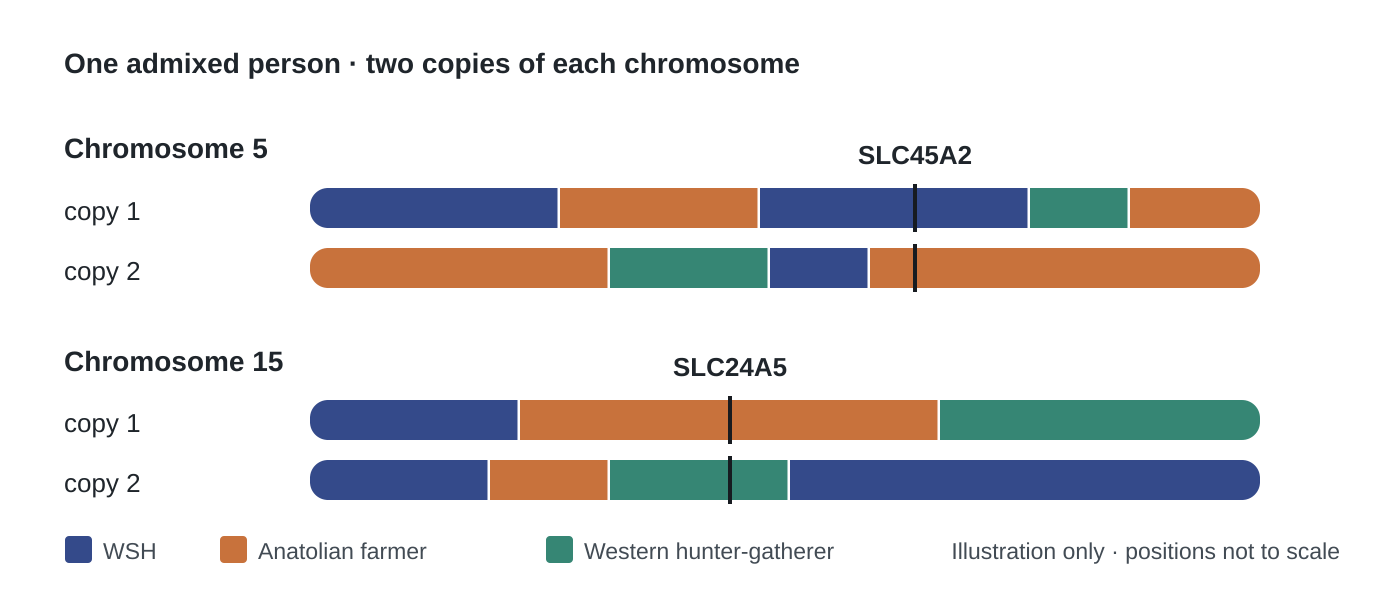
Figure 1 shows why chromosome-level ancestry matters. A person can be 40% steppe-related overall while a pigmentation allele lies on a farmer-like or hunter-gatherer-like copy. Testing alleles on their own labelled copies offers a more direct comparison than pairing whole-genome ancestry with a whole-genome score. The inference still depends on the labels and the observed sites.
Figure 1. Ancestry labels can differ between chromosome copies
Start when a proto-Yamnaya source existed
Nikitin and colleagues date the formation of Serednii Stih to around 4500 BCE. Another study explicitly describes this group as Proto-Yamna. The primary analysis begins at 6,500 years before present (BP), approximately 4550 BCE on a 1950 reference; a 6,000 BP check begins near the estimated formation of the Core Yamnaya mixture. These are rounded boundaries around historical processes, rather than exact first births of an ancestry.
This cap removes much older Europeans whom a closed-set classifier had labelled partly “steppe” despite predating the source. The forced three-way model still assigns a known label even when a chromosome has another history. All tract percentages and scores below refer to classifier-labelled sequence.
Where the samples come from
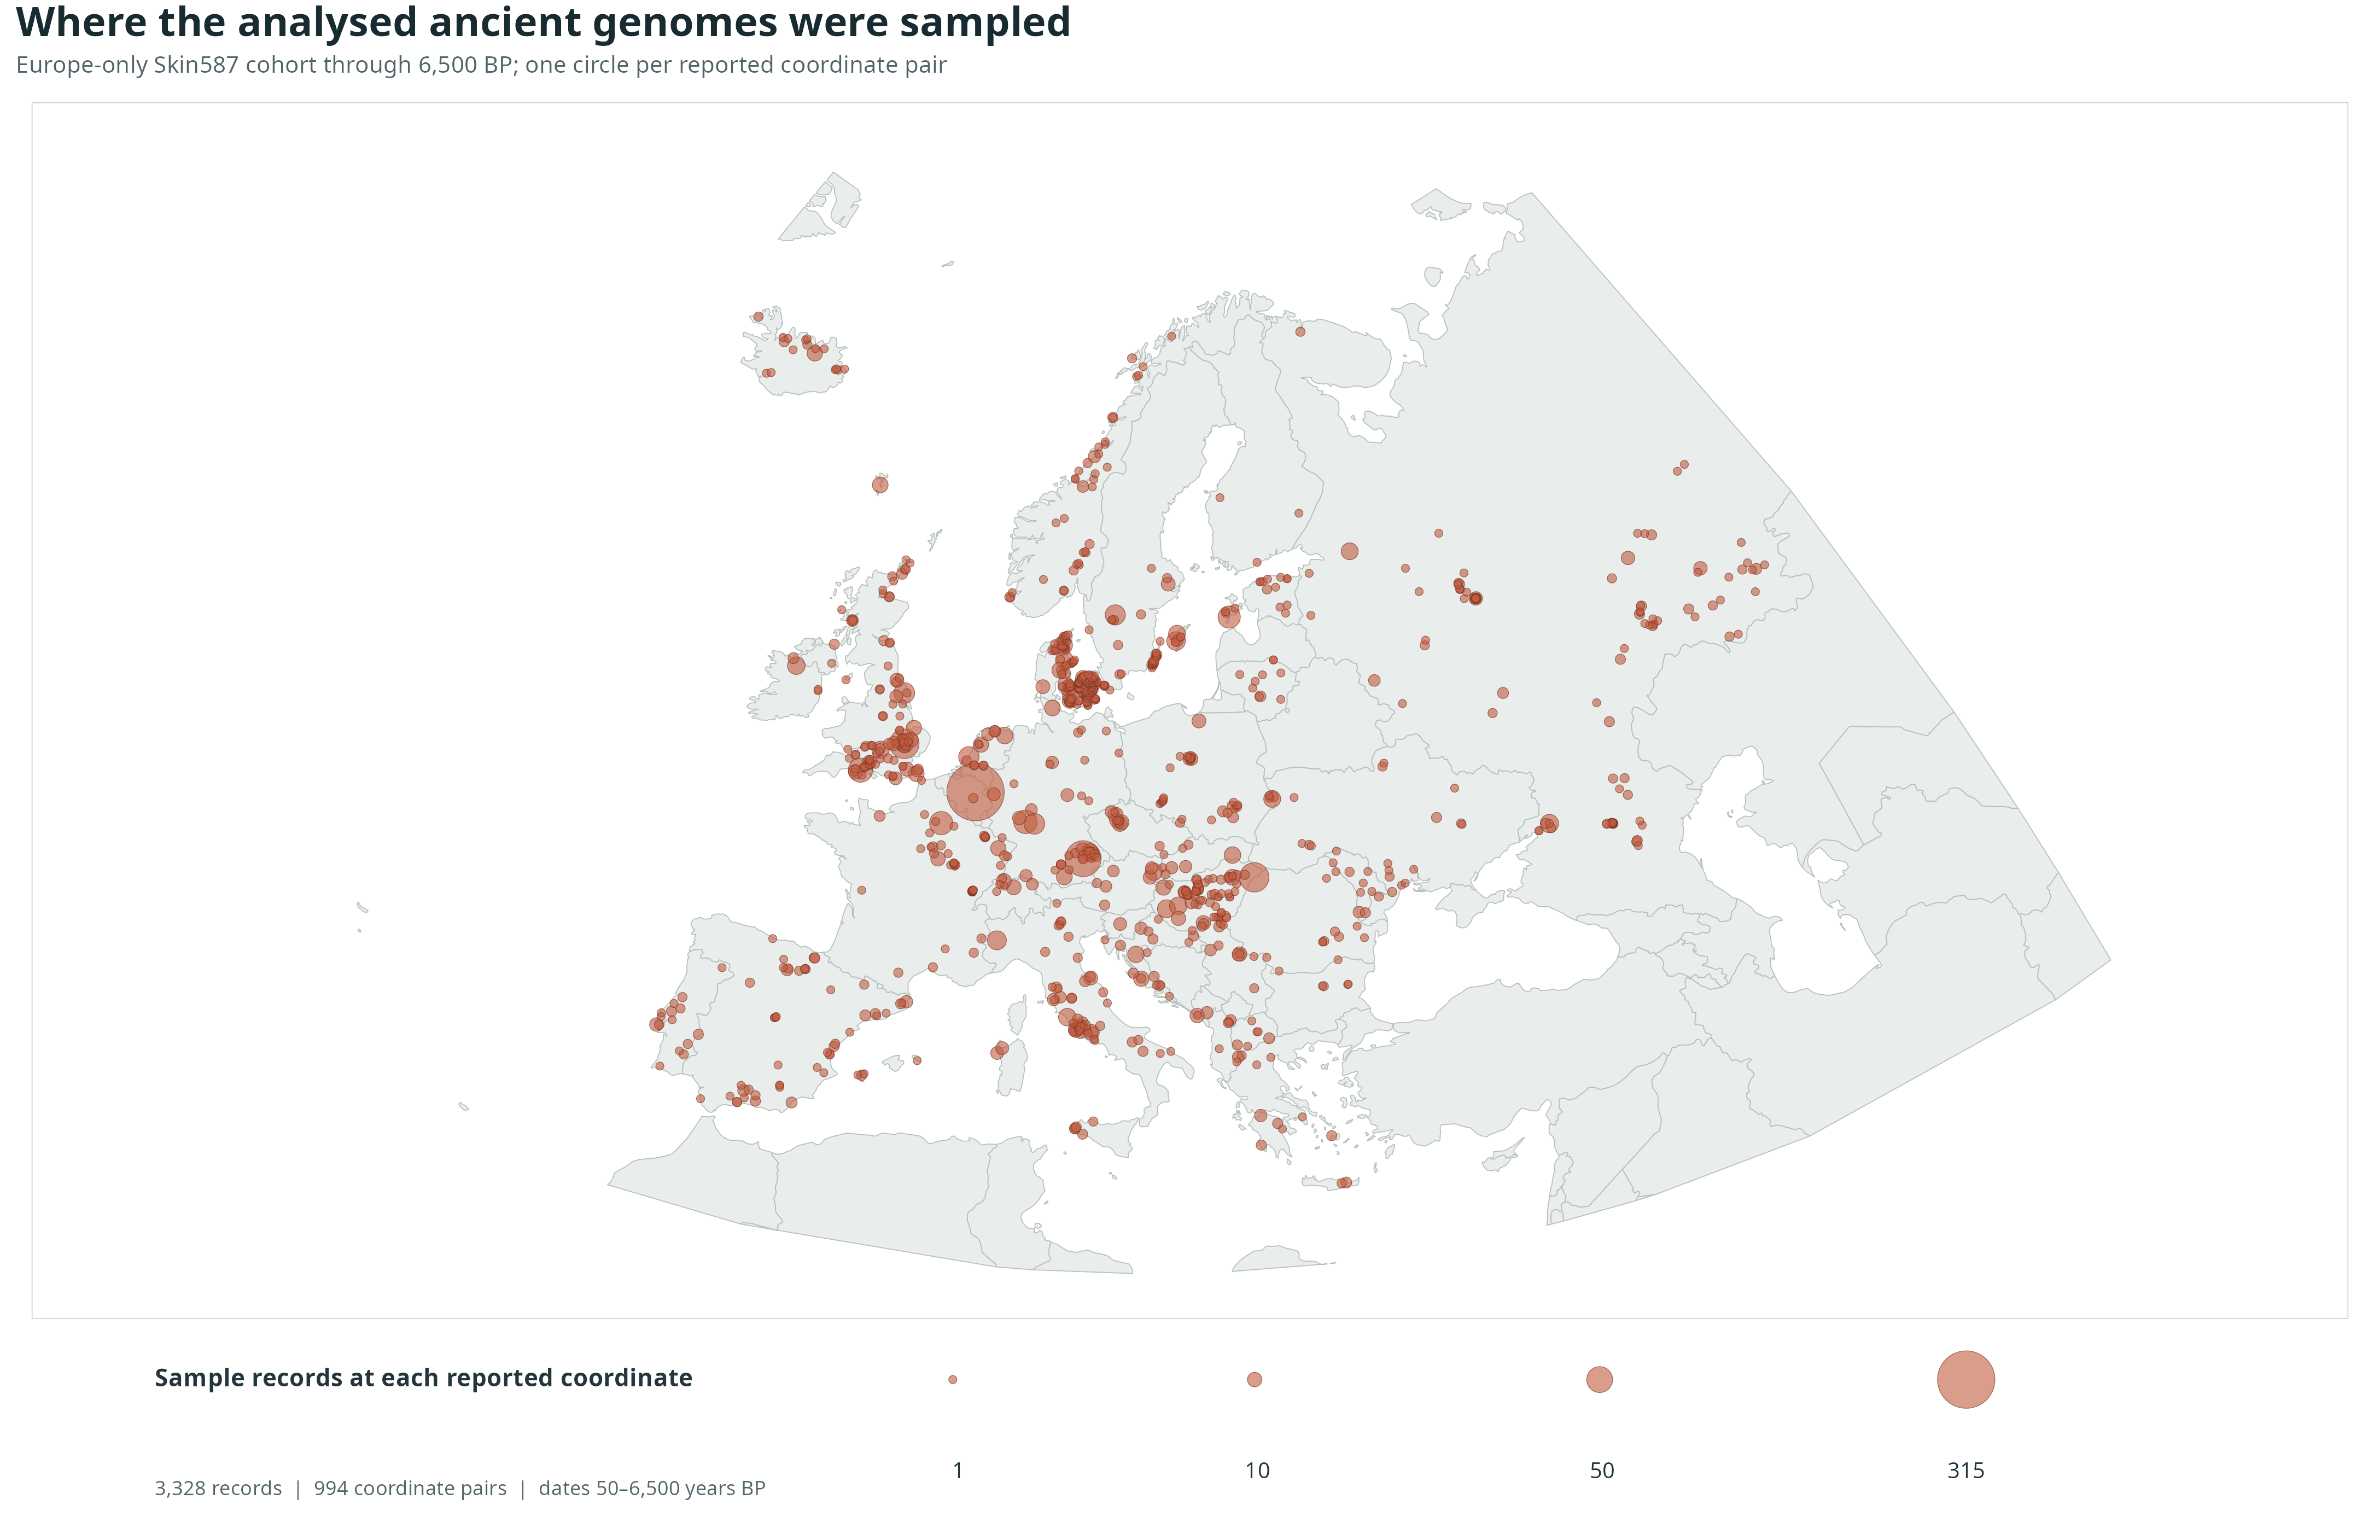
The main Skin587 cohort contains 3,328 European sample records dated ≤6,500 BP, with coordinates, paired WSH/non-WSH scores and a stored genotype-probability (GP) quality proxy above 0.9. A
Figure 2. Reported localities of 3,328 eligible European sample records
Did WSH-labelled chromosomes become lighter?
The 587-weight Skin587 score points toward darker pigmentation as it rises. Of its 587 positions, 579 occur in the modelled chromosomes. I averaged the observed effect-allele contributions separately on WSH-labelled copies and across all valid chromosome copies in the same people. The whole-genome comparison therefore uses exactly the same usable allele opportunities as the local scores. Both slopes share one fixed score scale.
Older samples have a higher score on WSH-labelled copies: +0.1640 fixed score standard deviations (SD) per 1,000 years older (study-clustered 95% interval +0.0955 to +0.2324; p=.001). The matched whole-genome slope is +0.1495 (+0.0928 to +0.2063). Thus the WSH-labelled score moved in the lighter-associated direction toward the present, as did the genome-wide score (Figure 3; Table 1, panel A).
Figure 3. Skin-score change within WSH-labelled ancestry and across the genome
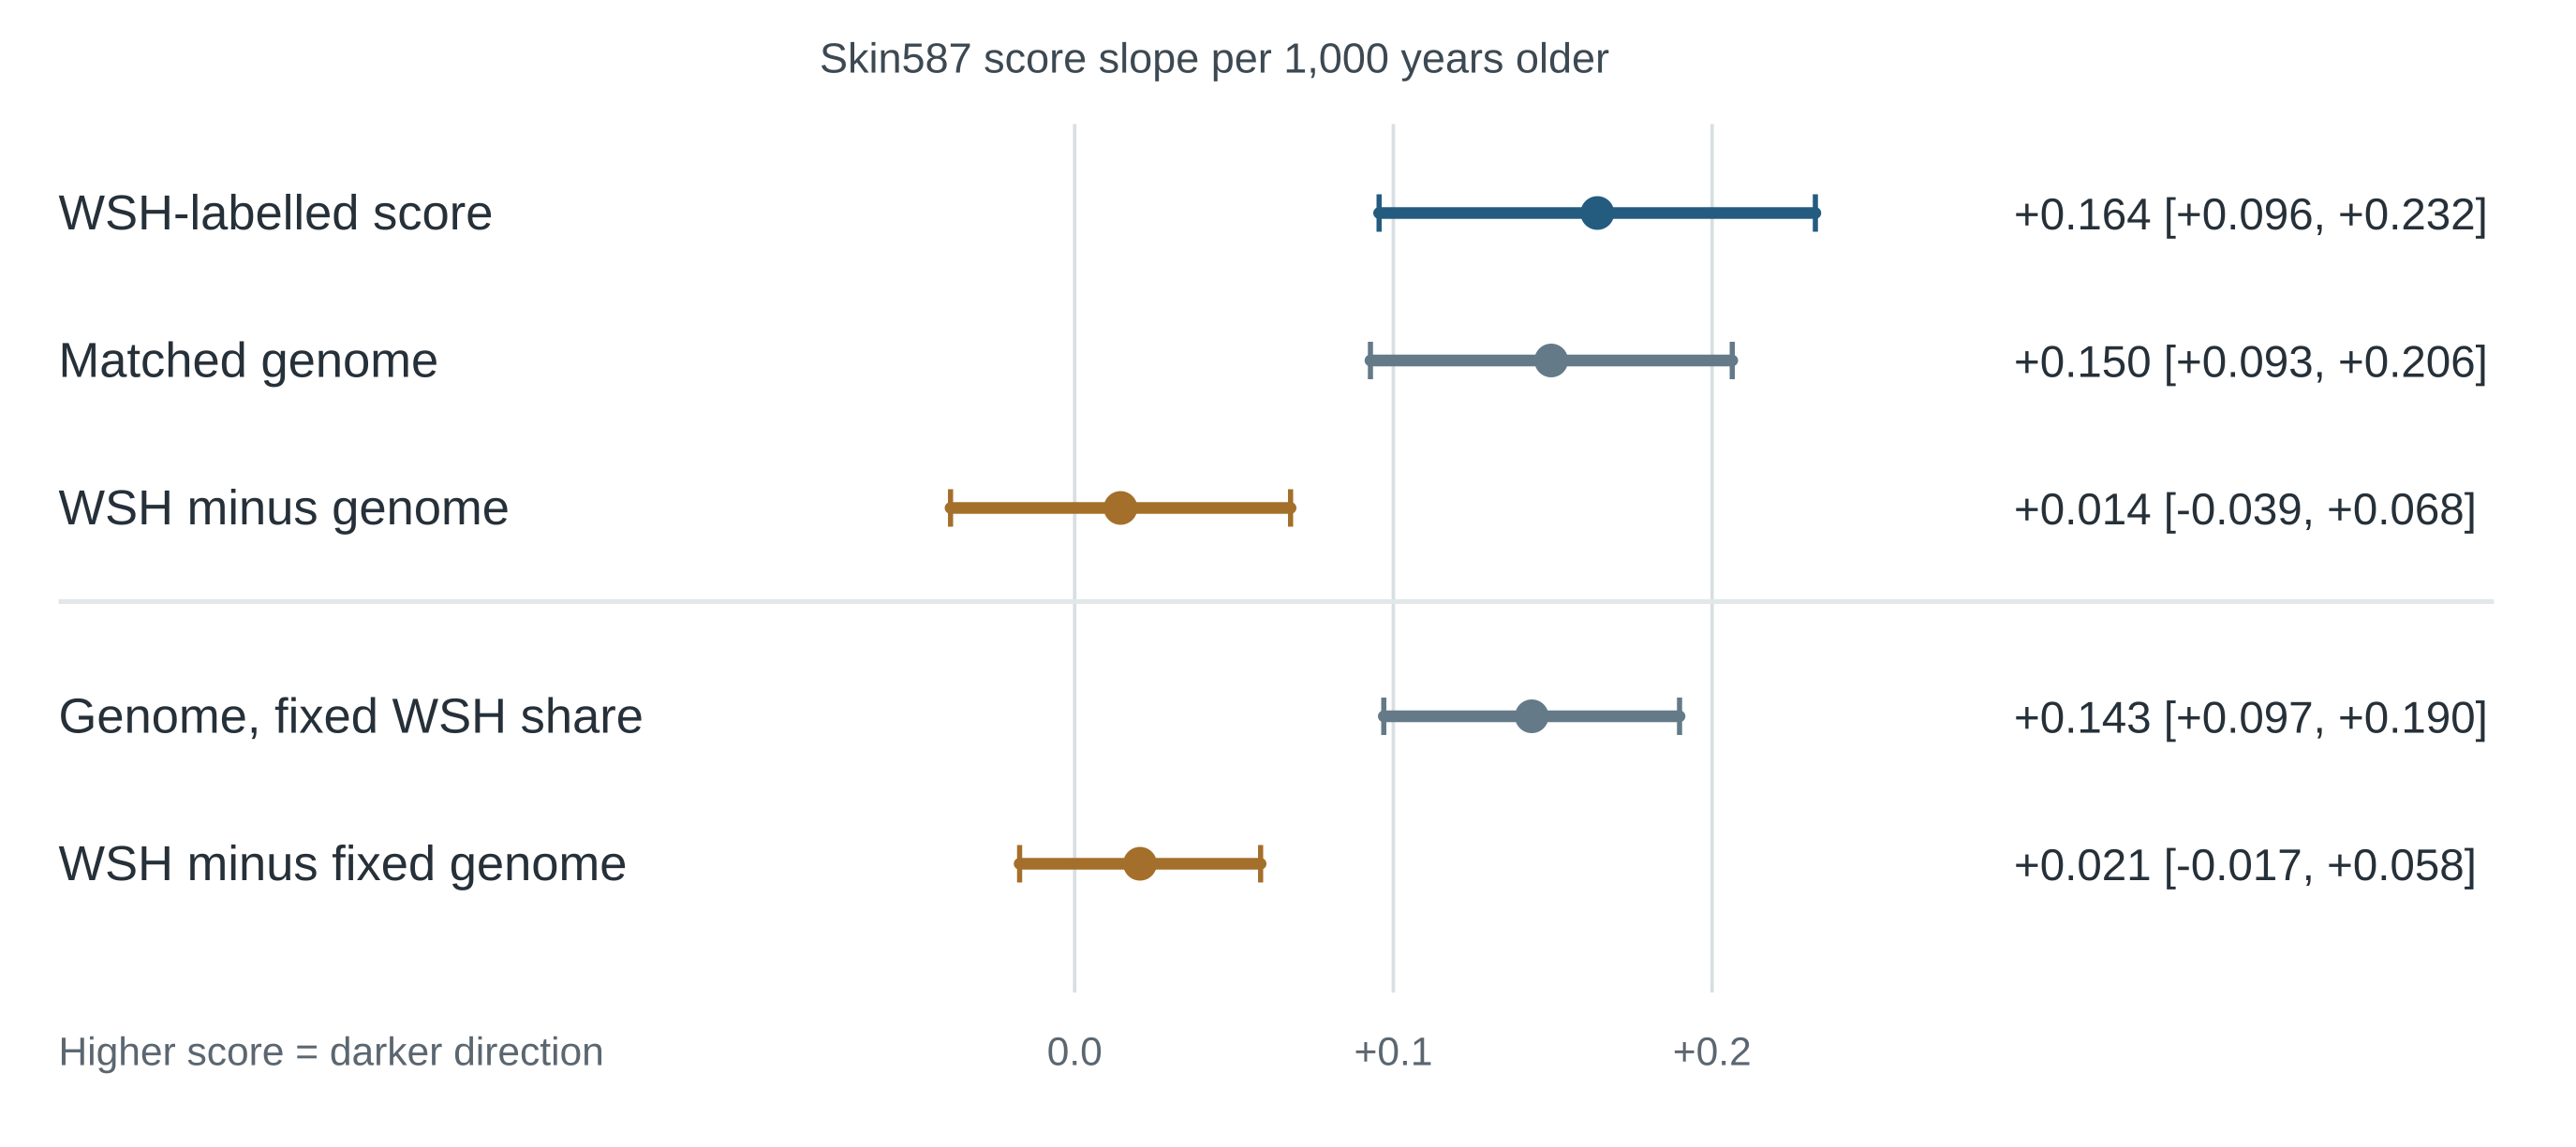
The WSH estimate is slightly larger. The direct WSH-minus-genome slope is +0.014 fixed SD per 1,000 years older (−0.039 to +0.068; p=.526; Figure 3; Table 1, panel A).
A score trend among WSH-labelled tracts is consistent with lightening on that ancestry background. Testing natural selection requires comparing the frequency trajectories of its pigmentation alleles with suitable matched neutral variants on well-validated ancestry tracts. Ju and Mathieson found evidence of skin-pigmentation selection in steppe-assigned people using whole-genome scores and 10,000 frequency-matched control panels. Their whole-genome test leaves the WSH-specific case open.
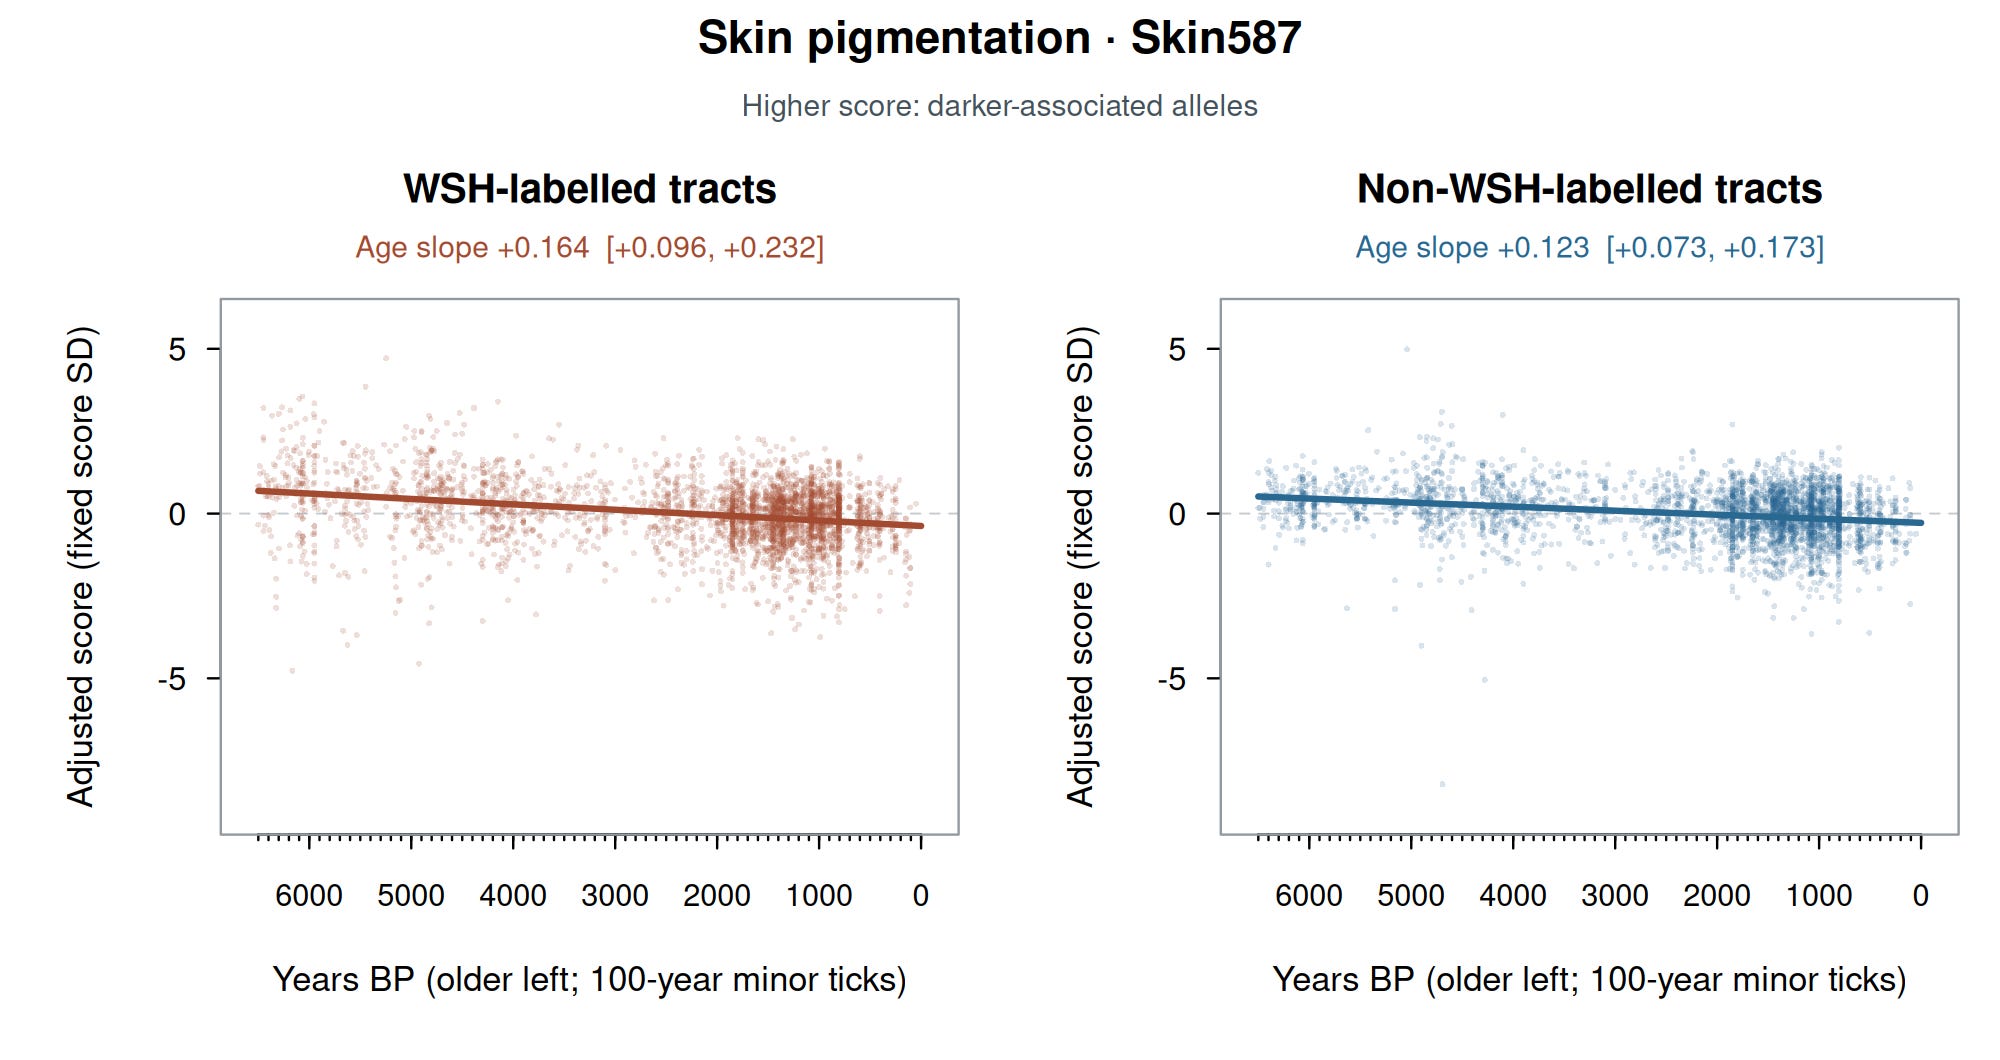
Figure 4 shows the two Skin587 age trends in Table 1 against each sample’s actual date. Older samples are on the left in every panel. I keep each date in Years BP so the horizontal distance still means elapsed time, rather than a deviation from the date predicted by study and location. The plotted scores account for study, location and the two imputation-variance measures; the lines have the adjusted age slopes in Table 1. The dots do not show the unadjusted score levels of WSH and non-WSH ancestry.
Figure 4. Adjusted Skin587 trends on WSH and other chromosome copies