

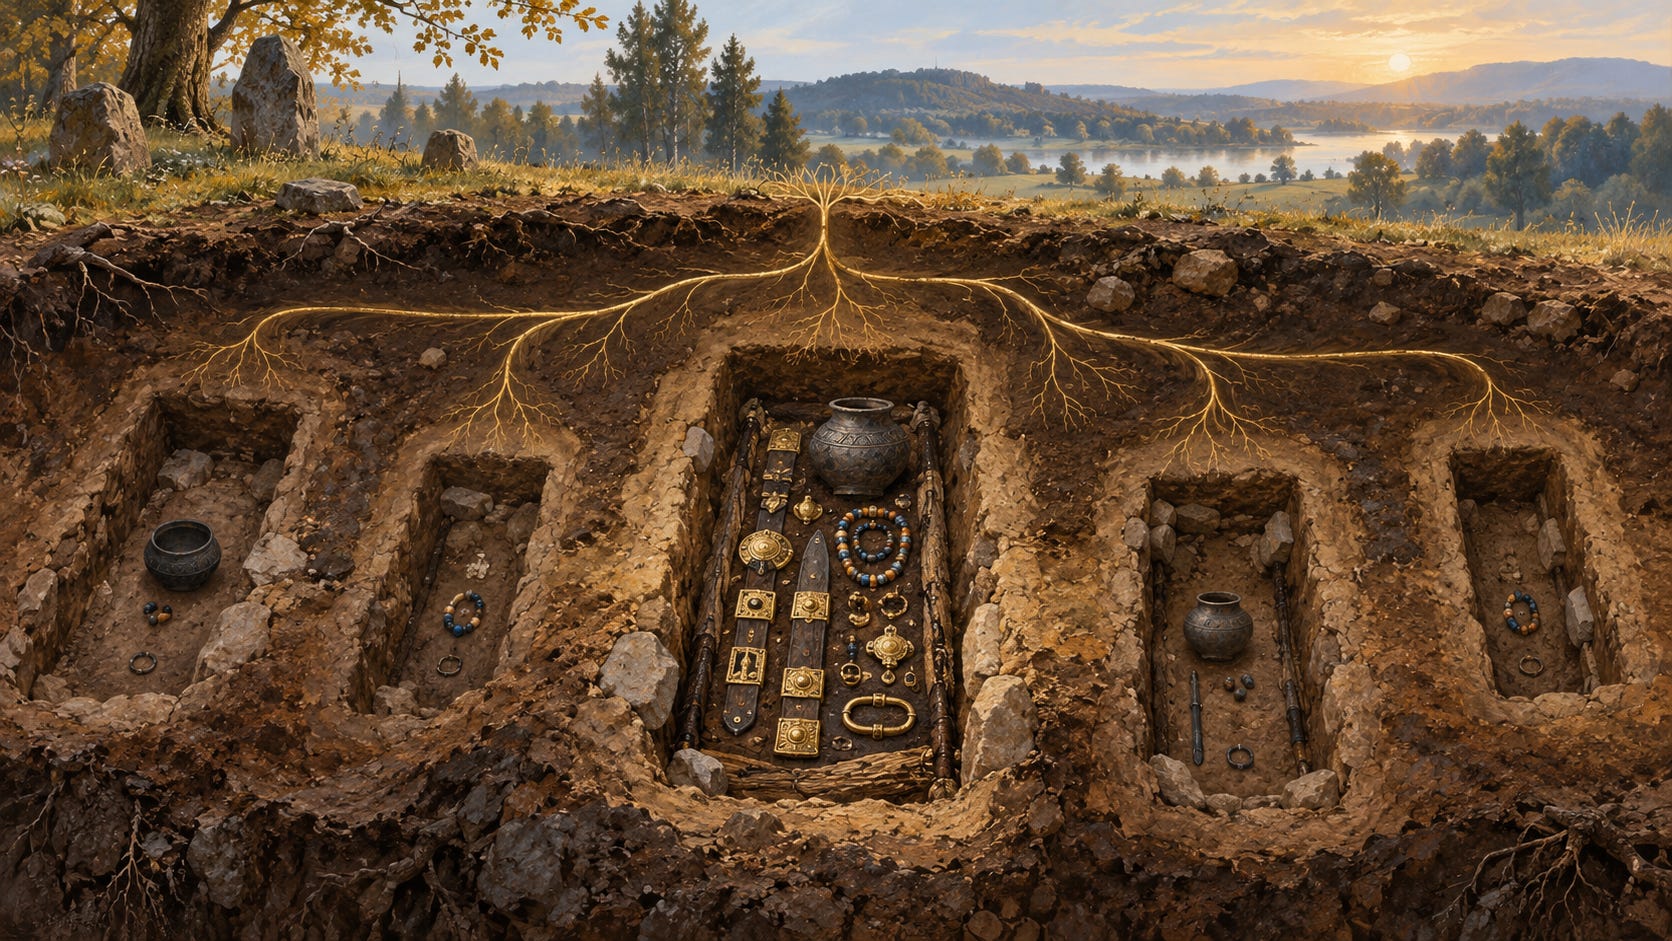
A richly furnished grave makes me wonder what set its occupant apart. In my earlier post, Digging the elite: richer graves, lighter skin?, I explored whether people buried with more goods also differed genetically. Richer burials were associated with higher fluid-intelligence scores and a pigmentation score pointing toward lighter untanned skin. These scores summarise genetic variants associated with traits in modern studies; fluid intelligence refers to reasoning through unfamiliar problems.
But a cemetery can preserve a family’s history as much as a community’s social hierarchy. Imagine several relatives receiving elaborate burials. They share DNA and may also share inherited standing. Counting them as independent examples could make one dynasty look like a general connection between genes and privilege.
Since that post, I have checked additional burial inventories against their sources and combined 406 newly included people with the corrected earlier records. The resulting dataset contains 1,366 people. I first revisit the earlier associations, including the score linked to education today, before testing how much they depend on relatives.
I approach the family question in three ways. First, I remove close relatives until no documented first- or second-degree pair remains and repeat the analysis. Then I compare relatives buried differently in the same cemetery, with a separate check for brothers and sisters. Finally, I separate differences between family averages from differences among relatives in one model.
A family behind the comparisons
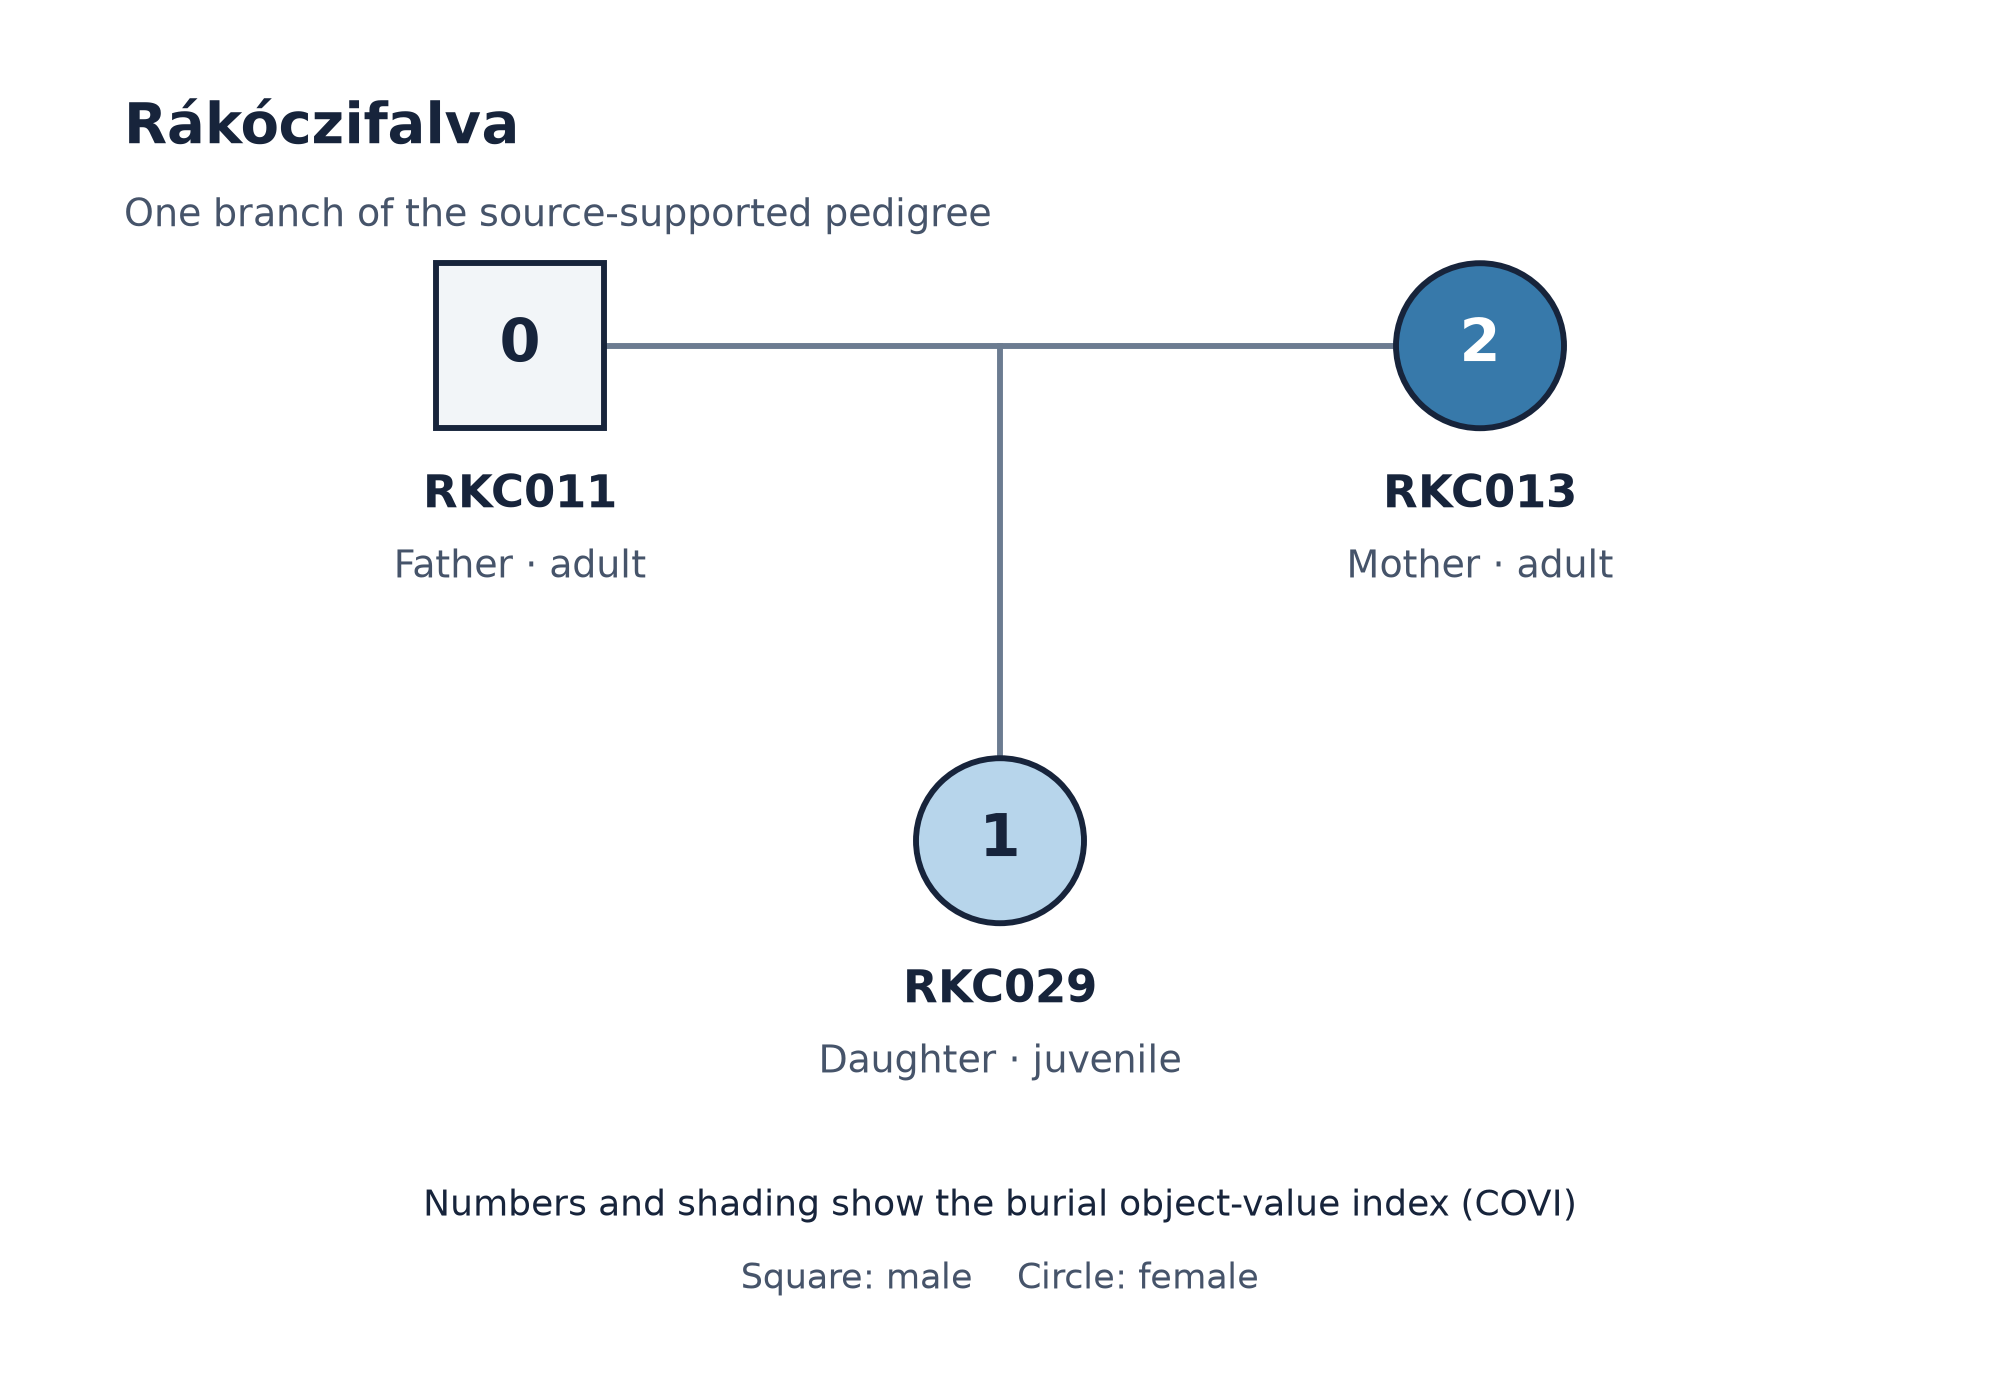
Figure 1 shows a small branch of an Avar-period family at Rákóczifalva in Hungary. The father, RKC011, the mother, RKC013, and their daughter, RKC029, all have genetic records and burial scores in this analysis. Their graves received different furnishing. The links come from the source-supported pedigree in the dataset, checked against Gnecchi-Ruscone et al. (2024).
Figure 1. Parents, their daughter and different burial scores
Between-group models compare average genetic scores with average burial treatment across documented kin groups in the same cemetery. Everyone eligible stays in the comparison, including a group represented by one person. Within-family models compare relatives against their own family’s baseline: does the person with the higher genetic score receive the richer burial? The kin groups follow documented biological relationships from ancient-DNA studies and verified pedigrees; shared burial style alone does not define a family.
The initial cemetery models contain both kinds of difference. The family models focus on differences among relatives buried in the same cemetery. I then separate the between-family and within-family components explicitly. The logic of the comparison among relatives resembles a within-family genome-wide association study (GWAS): relatives inherit different combinations of variants. Here I test existing genetic scores against burial treatment, rather than scanning individual variants across the genome.
Figure 2 compares the earlier records, the enlarged dataset, two ways of removing close relatives, and the comparison within families. The earlier measurement scales are retained throughout.
Figure 2. Burial furnishing and genetic scores before and after the family checks
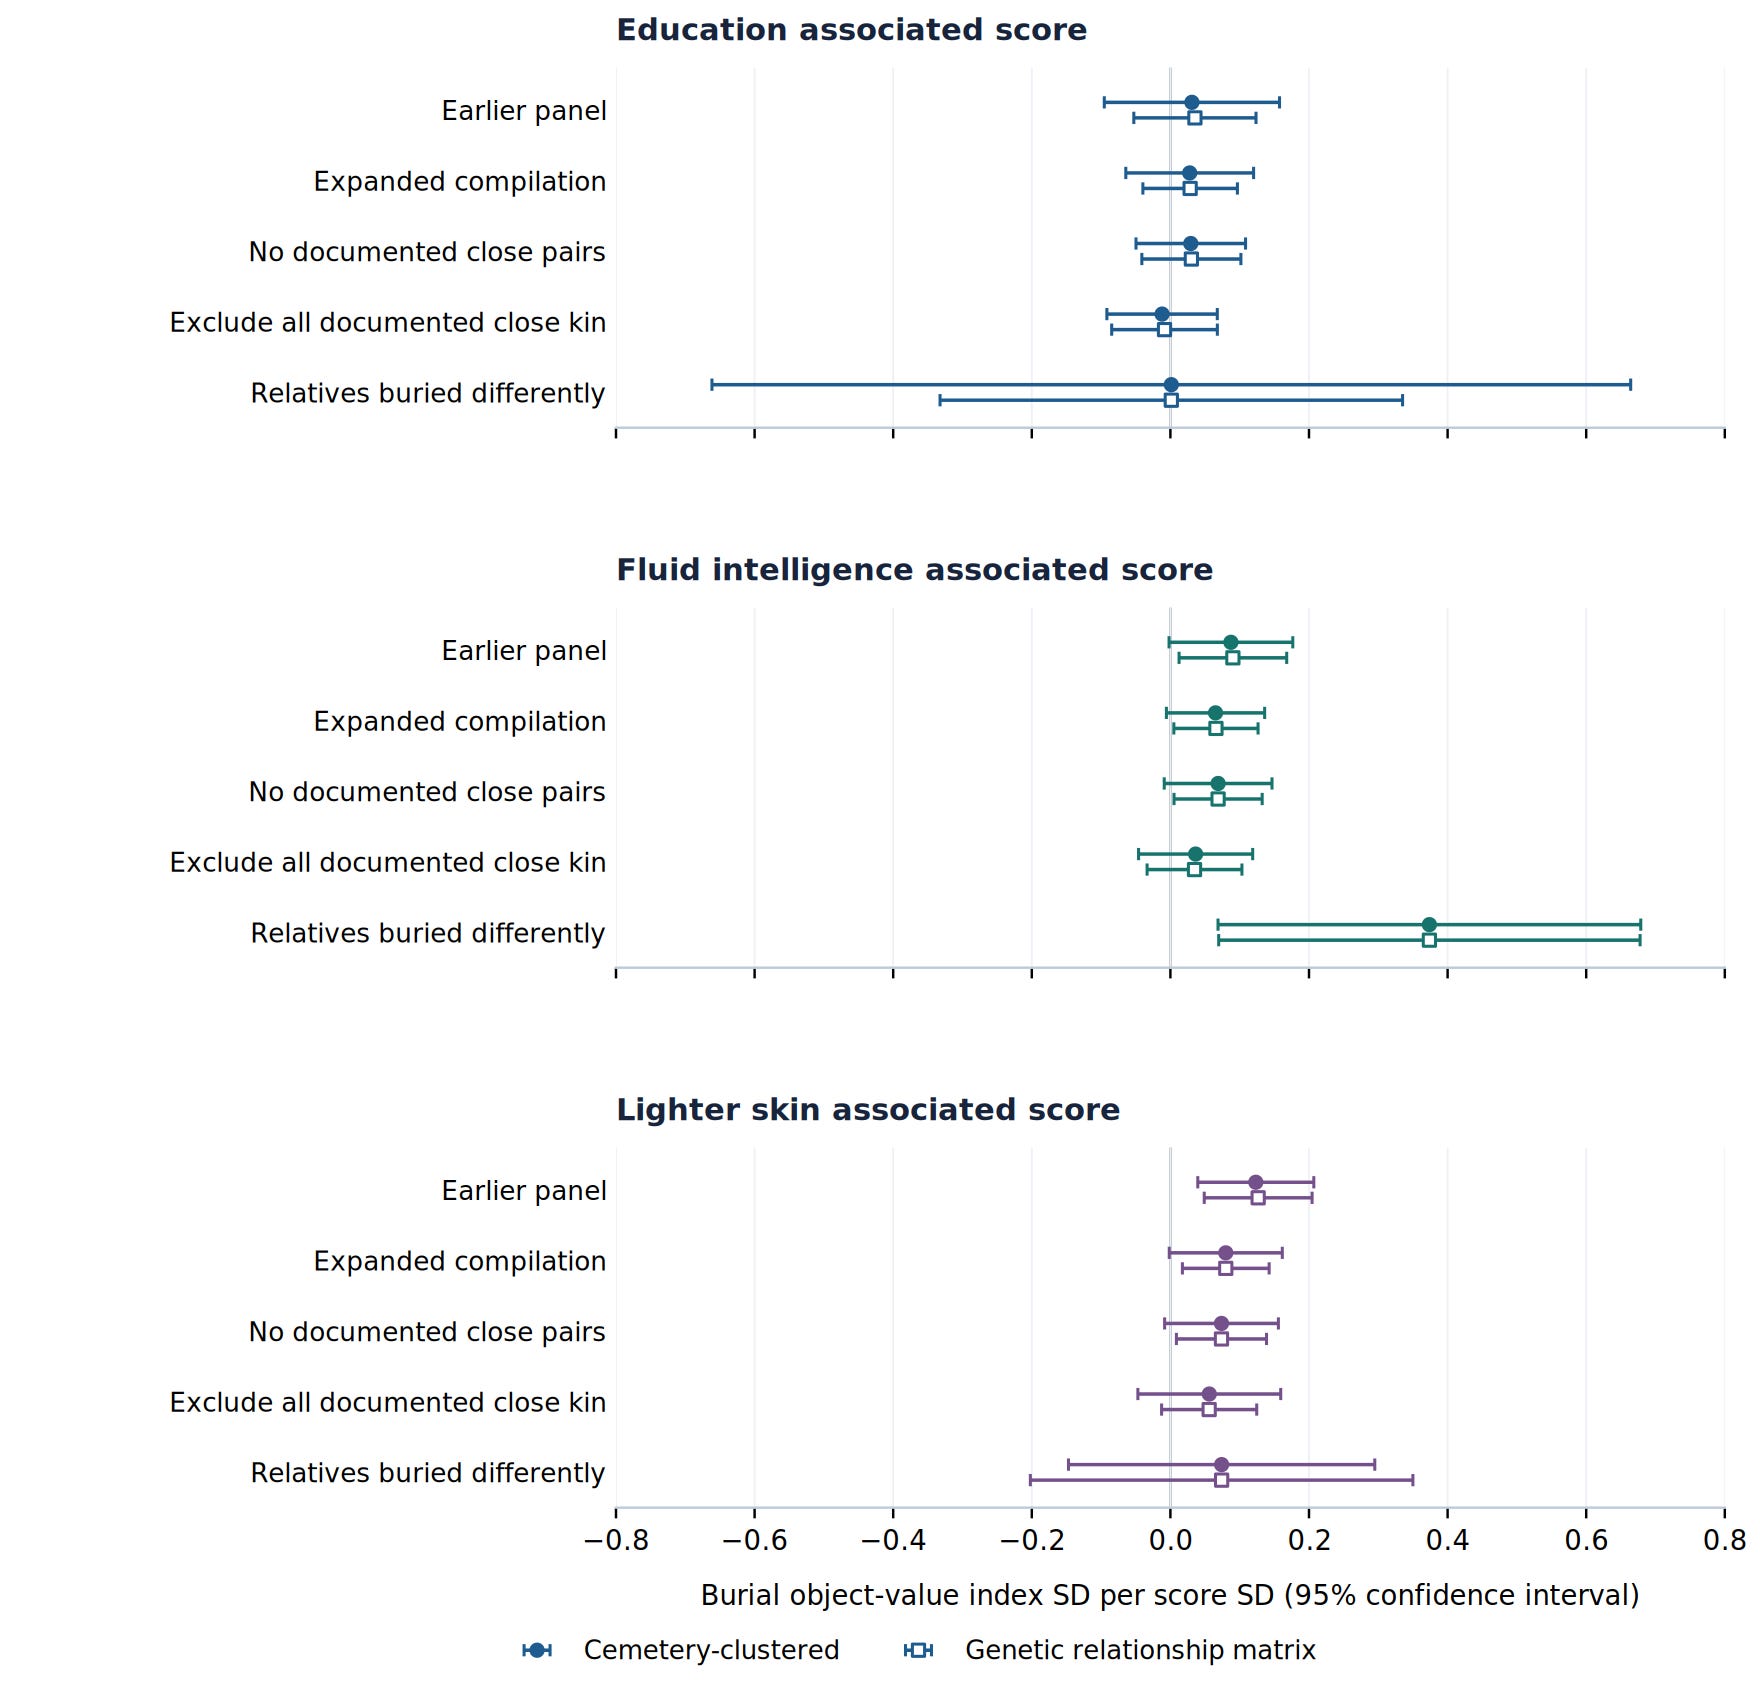
Figure 2 and the tables use the earlier within-cemetery standard-deviation units, with 95% confidence intervals.
Does inherited family standing explain the whole pattern, or do differences between relatives still show through? The fluid-intelligence result gives me a particularly interesting lead. Pigmentation brings a large Avar family into focus for a different reason. Following those two clues gets us closer to the question behind the rich graves: what came with the family, and what distinguished the individual?
Upgrade to see what survives when close relatives are removed—and why fluid intelligence and pigmentation tell different stories inside ancient families.
