

In The ingredients of light skin genetics, I found that European ancient genomes carried more variants associated with lighter skin pigmentation where farming had been established for longer. Lower ultraviolet B (UVB) exposure also pointed towards lighter pigmentation. I have now taken the same statistical model to East Asia.
I also ask whether the shift towards lighter-skin genetics happened faster in places with more or less UVB. Adding an “interaction” between time and UVB lets the rate of change differ with local sunlight. A positive interaction means that people living in higher-UVB environments shifted towards lighter-skin genetics faster; a negative interaction means the shift was faster where UVB was lower. Farming remains in the model, so this comparison accounts for how long agriculture had been established locally.
The proposed biological model balances the benefits of sunlight against ultraviolet damage. Melanin absorbs UV and may help protect folate, which is important for reproduction and early development. Yet UVB also starts vitamin D production in the skin, and melanin can limit the radiation available for that process. Where UVB is scarce, lighter skin could improve vitamin D production. UV exposure also raises skin-cancer risk, although its role in ancient selection is less certain because many cancers occur after the main reproductive years. Jablonski and Chaplin (2010) discuss this evolutionary balance.
Farming could change that balance through diet. If a shift towards cereals reduced vitamin D intake from foods such as oily fish, people would become more dependent on producing it in their skin. Under those conditions, variants associated with lighter skin could become advantageous, particularly where UVB was already limited.
Farming may also have changed how much sunlight reached people’s skin. Settled life brought more indoor activities, potentially making vitamin D harder to obtain—although working the fields still meant plenty of time outdoors. Together with changes in diet, this gives us a reason to ask whether farming helped favour lighter skin.
That farming signal turns up again in East Asia when I use a genetic score developed from East Asian data and account for relatedness between the ancient individuals. In both Europe and East Asia, the scores also point towards lighter skin over time. But sunlight throws a curveball: in East Asia, higher UVB goes with a higher score for lighter skin—the reverse of the European pattern.
Different genes can lead to lighter skin
A polygenic score weights and adds genetic variants associated with a trait in modern people. A skin-colour score that works in Europe is not automatically the best instrument for studying East Asian prehistory. Similar pigmentation can be reached through partly different genetic routes.
Kim et al. (2024) measured skin colour in 48,433 East Asians. Their study found substantial differences from European pigmentation genetics. Some genetic variation associated with lighter skin is shared, including an allele near KITLG, while variants involving SLC24A5 and MC1R show population-specific patterns. Their East Asian light-skin score explained approximately twice as much variation when applied to East Asians in UK Biobank as when applied to Europeans.
I use the same score as in my European analysis, alongside one developed from East Asian data.
The panels capture different parts of pigmentation genetics. A contrast between their ancient trends is consistent with the genetic differences described by Kim and colleagues, although this comparison alone cannot establish why their results differ. Neither panel reconstructs a person’s exact complexion.
The long trend is towards lighter pigmentation
First, consider the broad chronological pattern before asking what farming or sunlight might explain. I use gamma, γ, for the change in the lighter-skin score as time moves towards the present. Positive gamma means an increase in variants associated with lighter skin pigmentation.
Figure 1 shows the result. A genetic relationship matrix (GRM) accounts for genome-wide similarity between people. With that adjustment and study effects, European Skin587 has an overall gamma of +1.20 score standard deviations per 10,000 years [95% interval: +1.00, +1.40]. East Asian Kim has a gamma of +0.78 [95% interval: +0.21, +1.34], with p=.007. Both directions are also positive without GRM adjustment (Table 5).
Skin587 gives a different answer in those same East Asian genomes: its trend is uncertain, with an interval spanning zero. The East Asian score detects a trend towards lighter skin pigmentation that Skin587 does not clearly capture. The choice of score therefore matters to the historical story.
Figure 1. Overall trends in lighter pigmentation scores
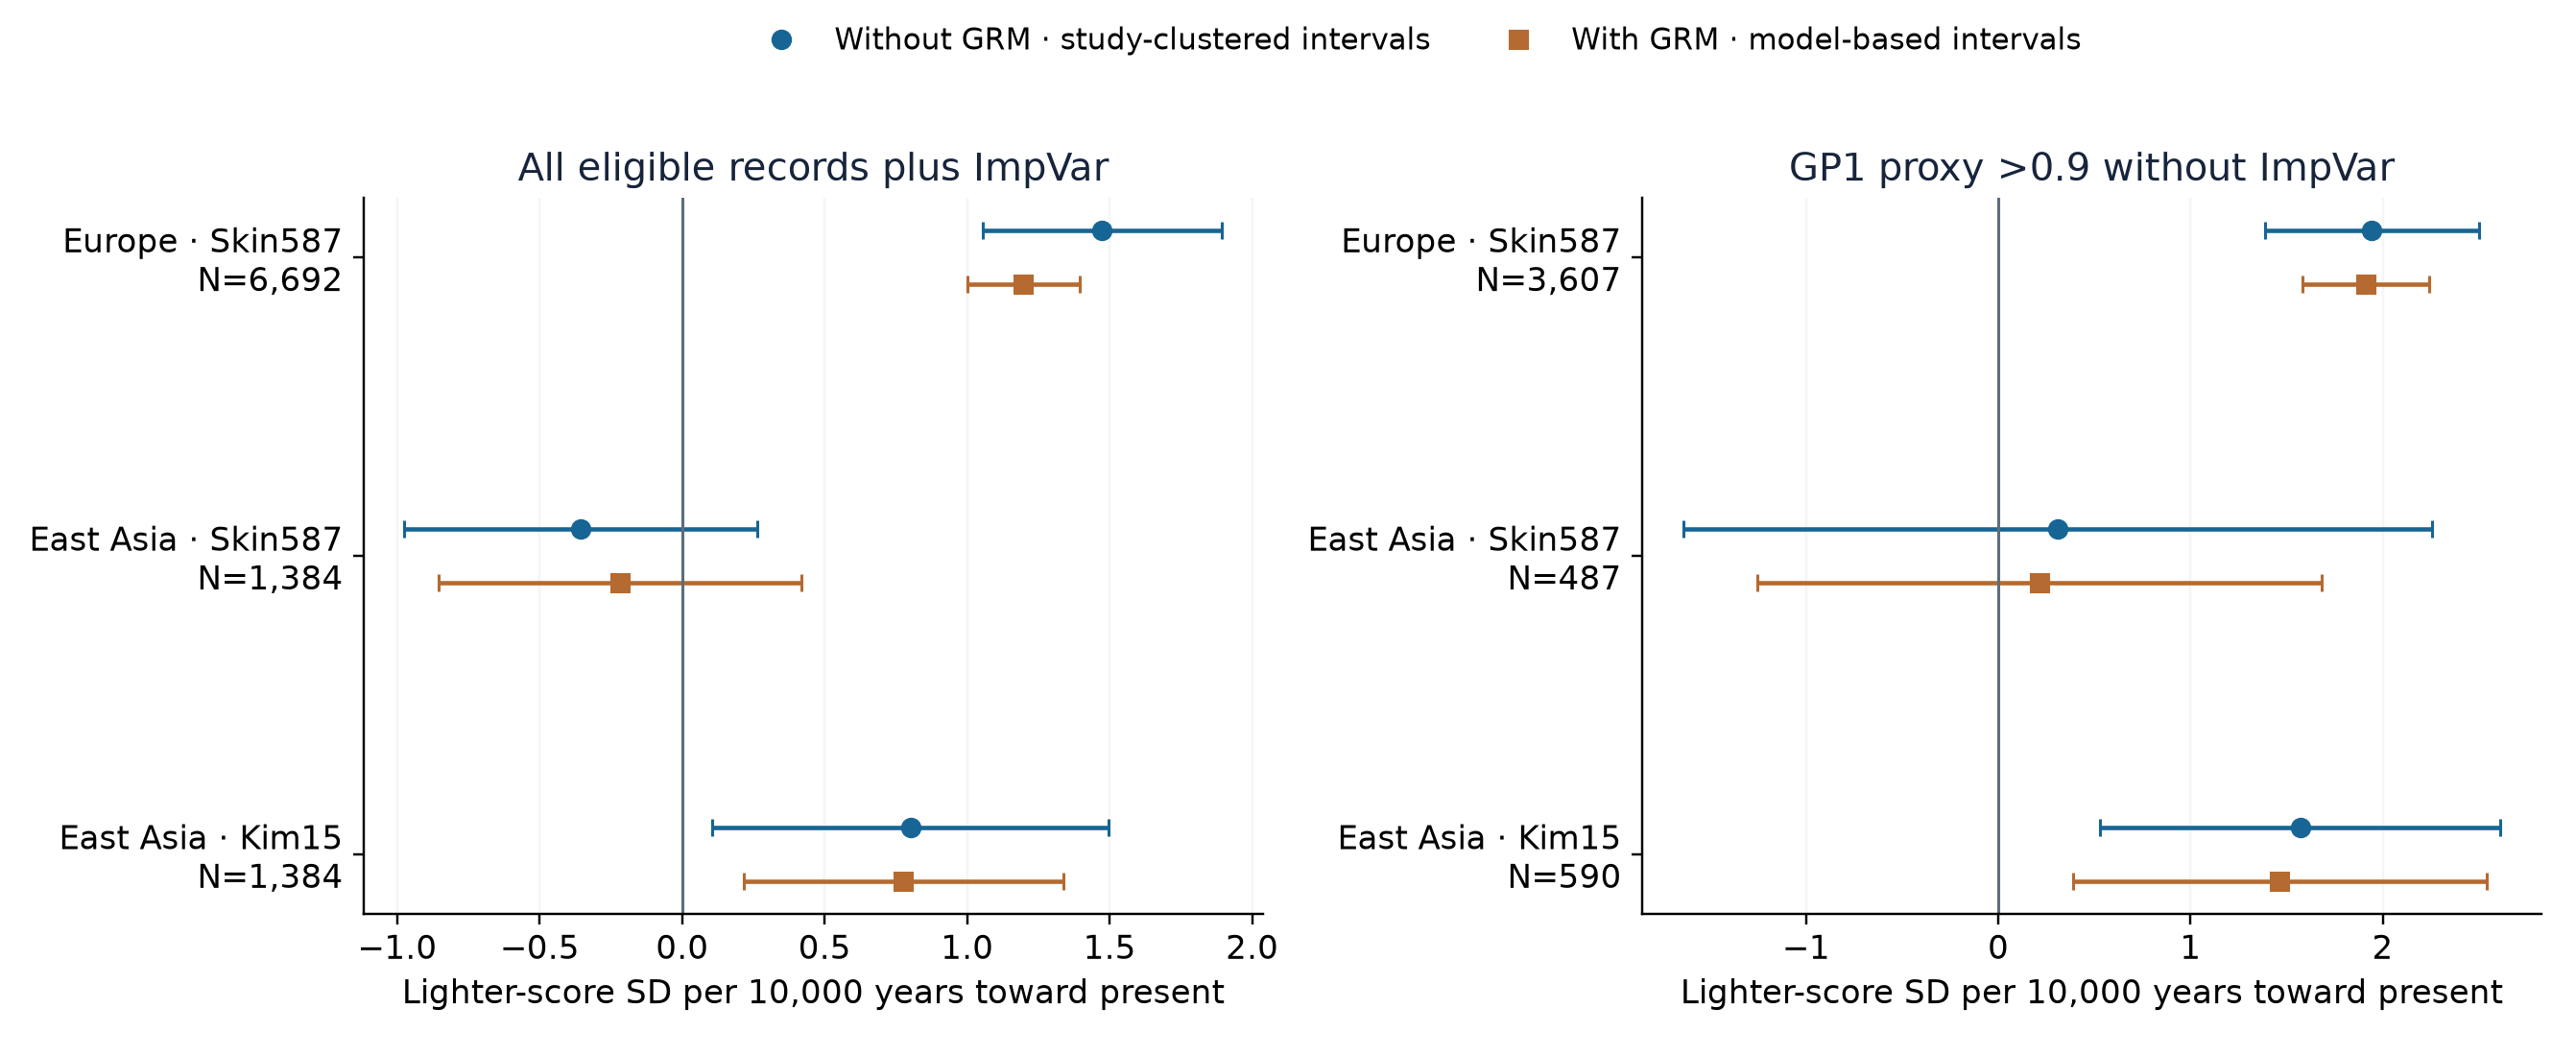
Figure 2 puts those trends back into the individual genomes. Each dot shows a person’s skin score after I account for differences between studies and, in the full sample, imputation uncertainty. I leave the dates unchanged. Europe uses Skin587 and East Asia uses Kim’s 15-variant score. The fitted lines rise towards the present in both populations, with and without genetic relatedness adjustment; the orange points and lines show the alternative genotype-confidence screen.
Figure 2. Adjusted lighter-skin scores through time
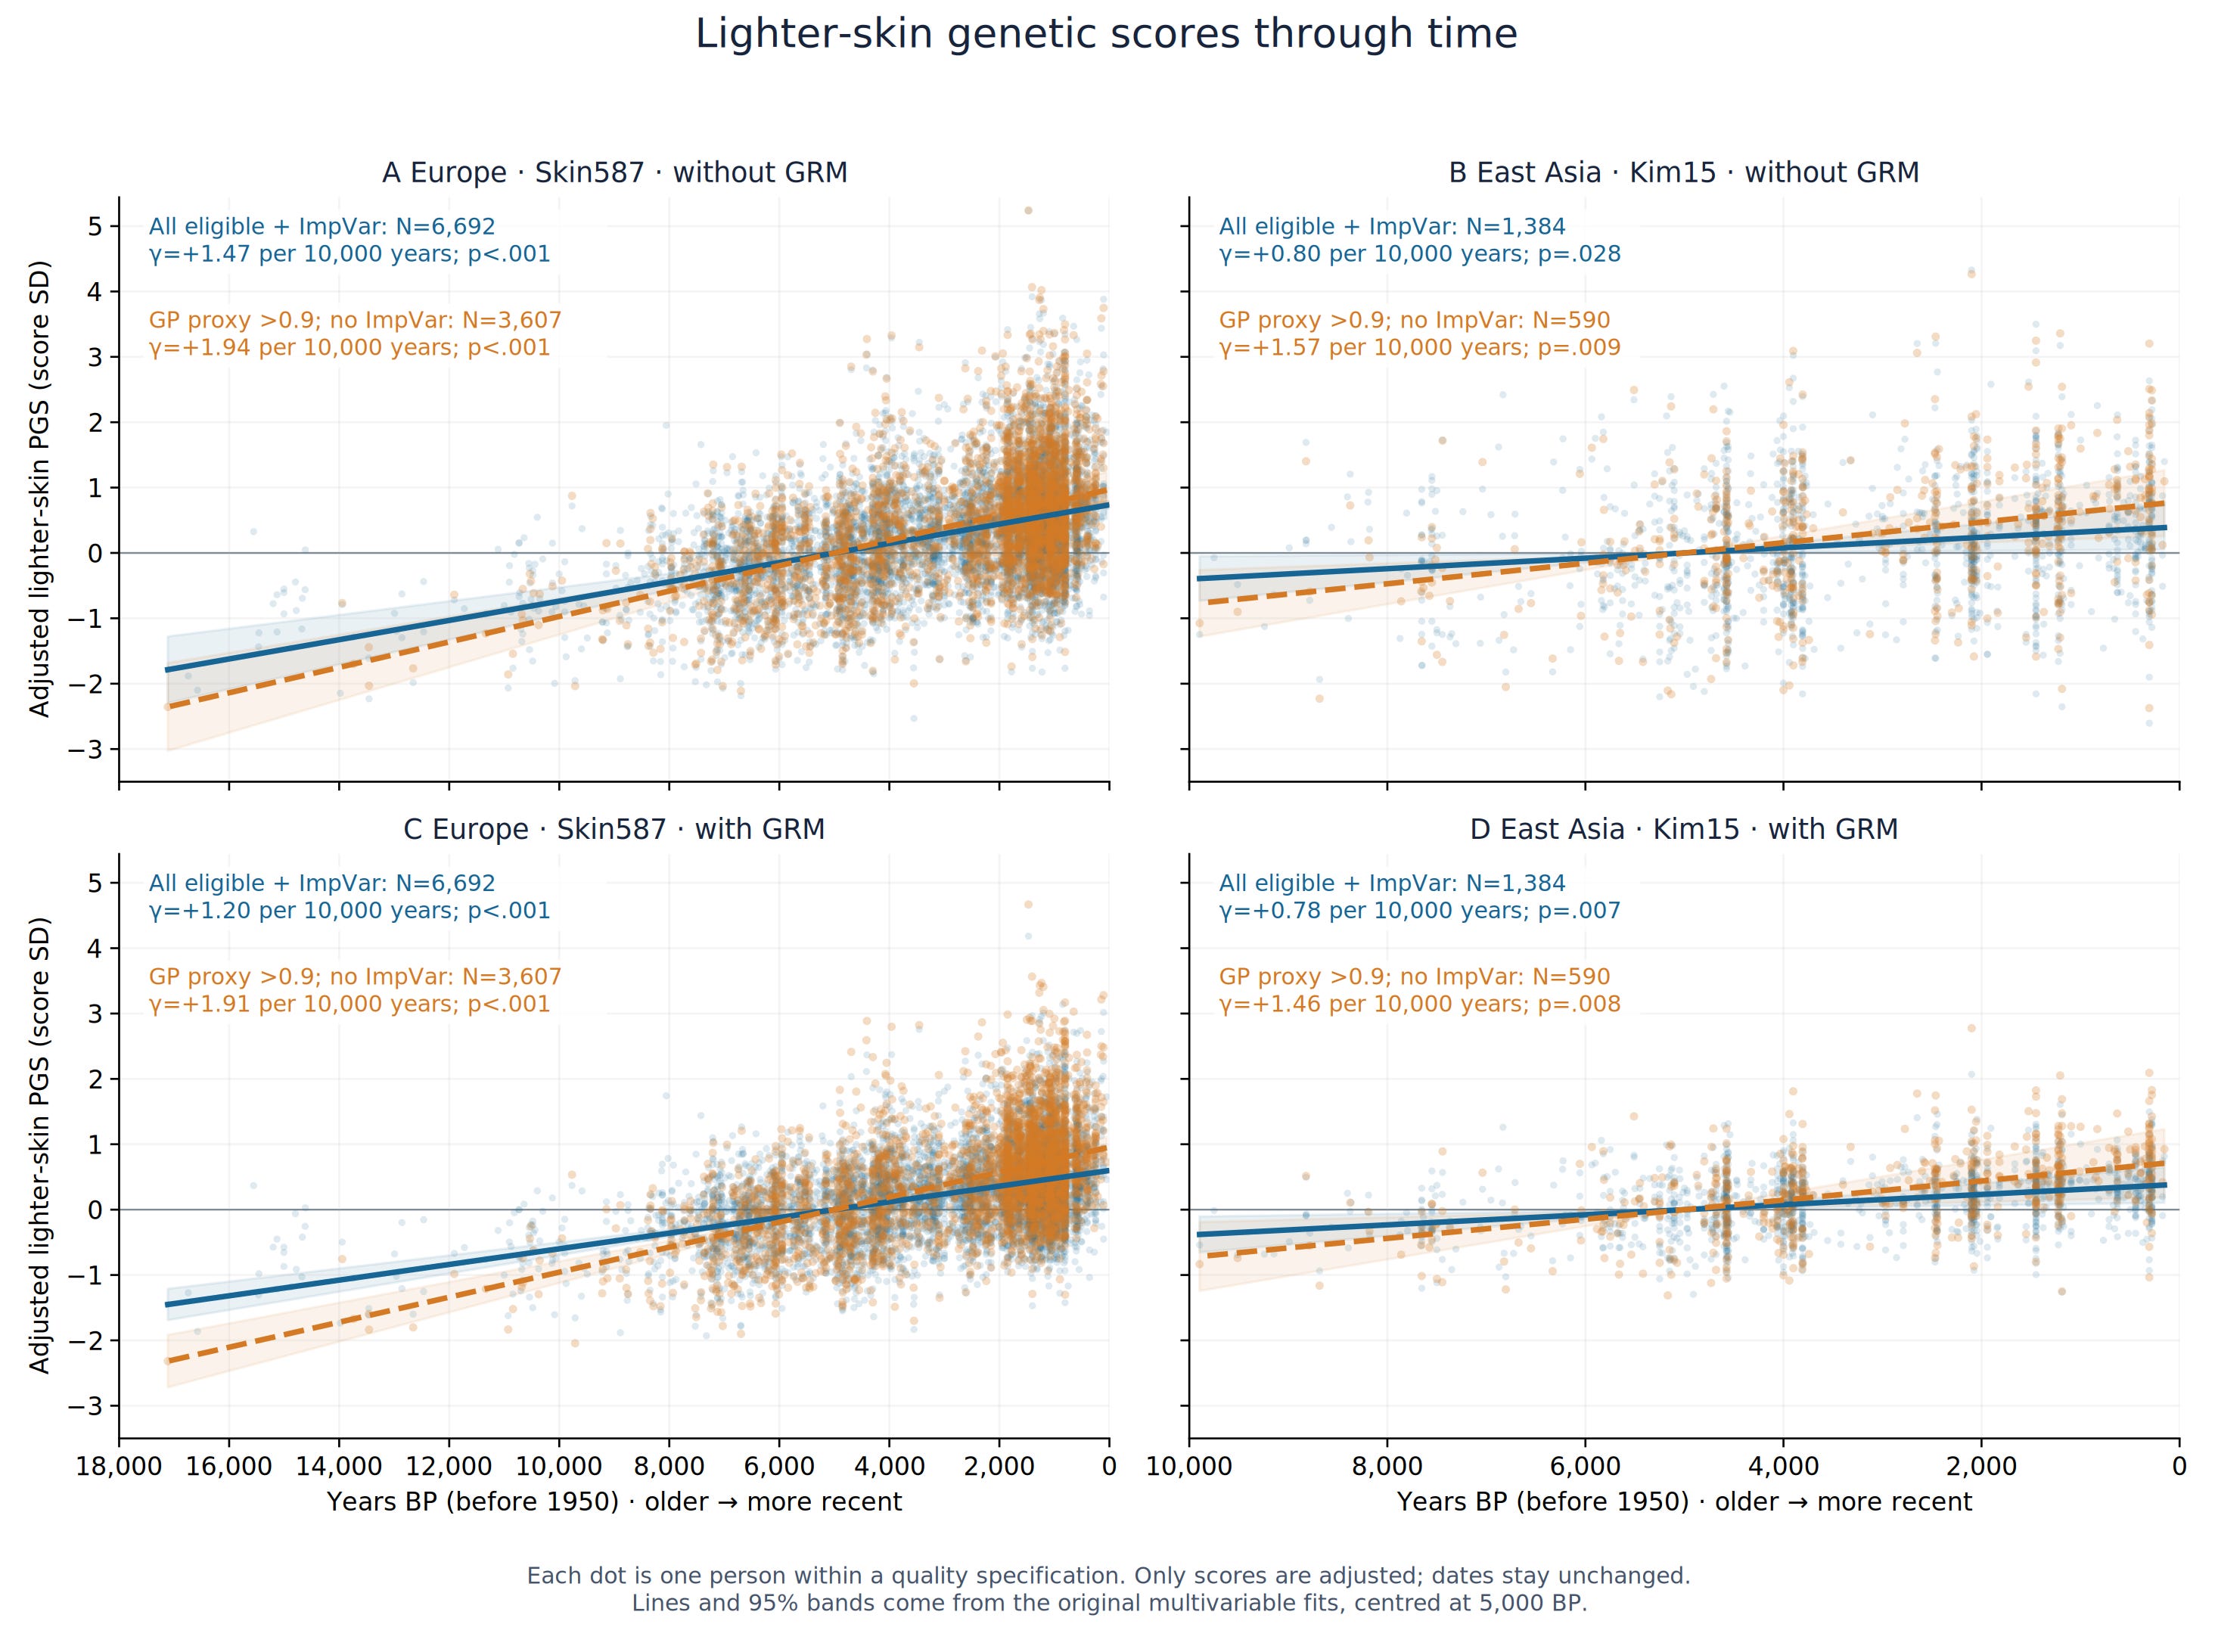
There are 6,692 European genomes and 1,384 East Asian genomes in the main comparison. Europe extends back approximately 17,100 years; the East Asian sample extends back approximately 9,900 years. The comparison follows the same modelling approach within each population, with different geographical and chronological coverage.
Below, I test whether farming helps explain the shift towards lighter skin on both sides of Eurasia, and investigate why the East Asian sunlight result turns the familiar evolutionary story on its head.