

In Solving the Aryan paradox: Why northern Europeans have fair skin but their ancestors were not pale, I asked why northern Europeans are generally fairer than southern Europeans while carrying more ancestry related to the Yamnaya steppe pastoralists, whose predicted complexions were usually intermediate. Readers raised two connected questions: how farming and sunlight shaped pigmentation, and which ancestral populations supplied the light-associated alleles.
The goal of this study is to test the hypothesis that lower local UVB exposure and a longer local history of farming are associated with lighter-pigmentation genetic scores (after accounting for sample dates). These associations leave room for migration and ancestry changes as well as dietary adaptation. After the paywall I will also answer the questions raised by the readers on X about the previous post.
Ultraviolet B radiation (UVB) starts vitamin D production in the skin. Melanin absorbs some of that radiation. Where UVB is scarce, especially at higher latitudes, less melanin allows more UVB to reach the skin’s vitamin D precursor at a given exposure. If this improves survival or reproduction, natural selection can favour light-associated alleles over generations. This is the vitamin D explanation for why low UVB could favour lighter skin. A farming diet could add to that pressure if it supplies less vitamin D than the foods it replaces. Jablonski and Chaplin 2010
The development of civilisation may also have increased time spent indoors. Less outdoor time would mean less UVB reaching the skin, even at the same ambient UVB intensity, potentially adding to the pressure favouring lighter skin. Our data contain no measure of time spent indoors, so we cannot test this possibility directly or determine how much of the farming association it might explain.
I use the continuous genetic score from the same 587 variants discussed in Can we predict population skin color with polygenic scores?. I call it Skin587 and reverse its original direction here so that higher values point towards lighter pigmentation.
(BP means years before 1950; kyr BP expresses dates in thousands of years. Score changes use a fixed ancient-cohort standard deviation (SD). Standardized regression coefficients rescale each predictor and the outcome by their variation among the same people, allowing the associations to be compared.)
Farming, ultraviolet exposure and pigmentation
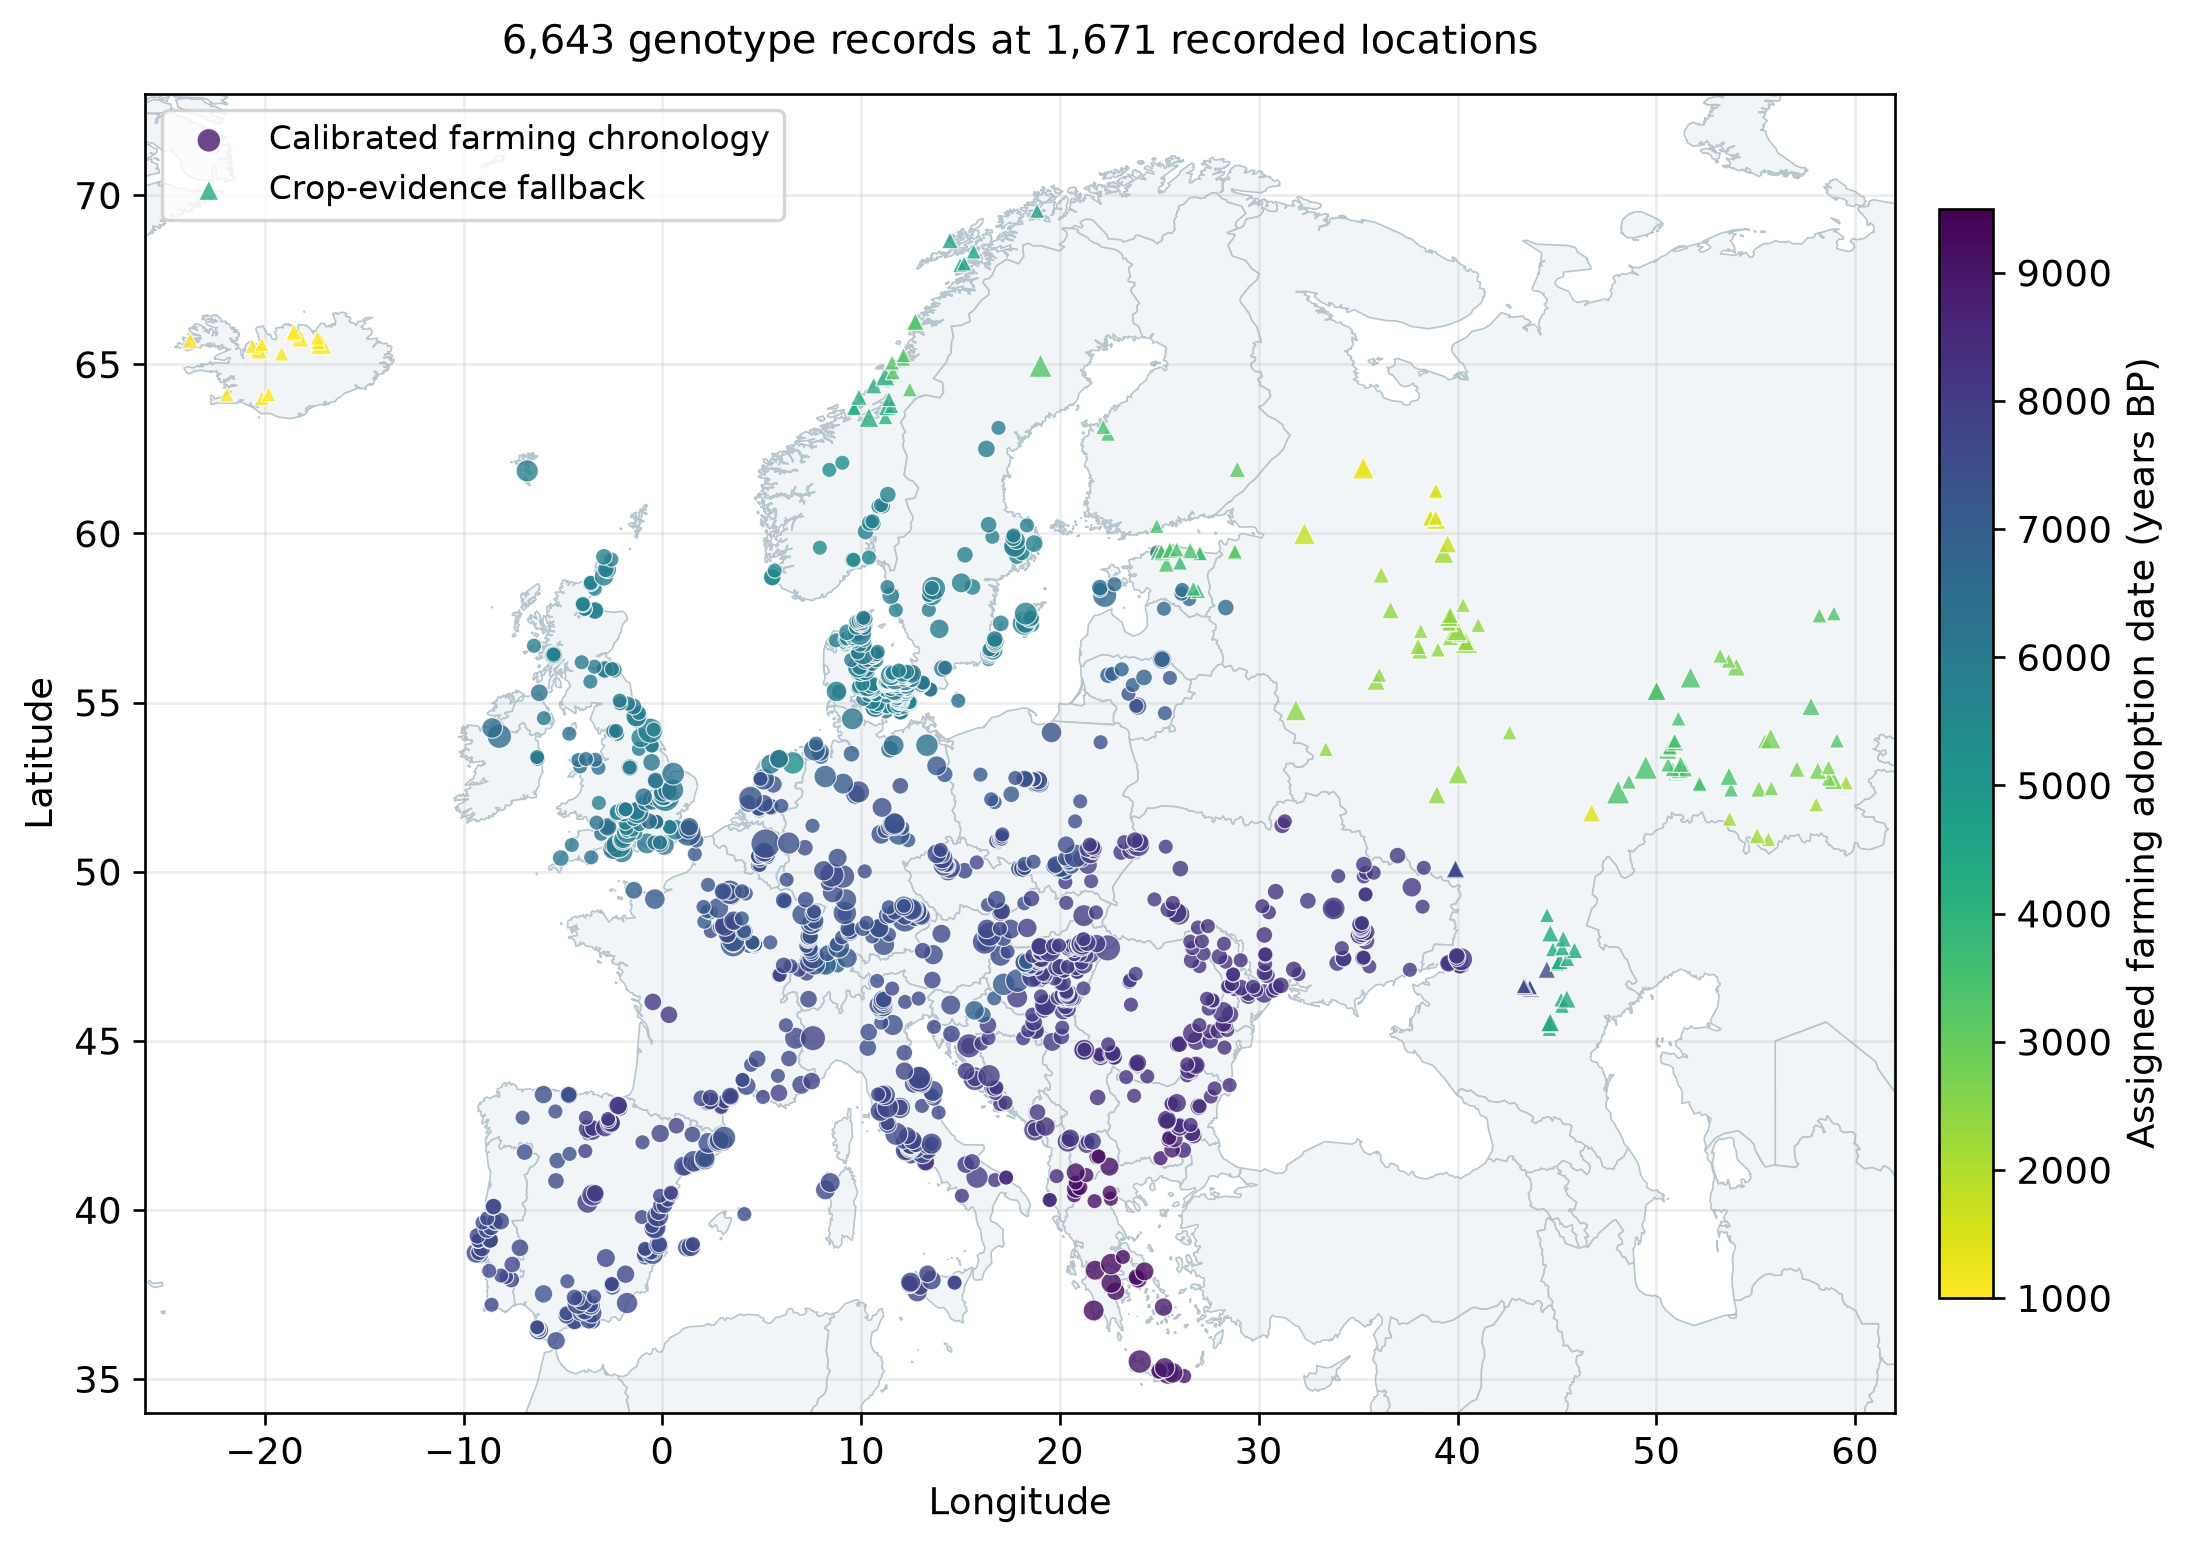
To test the proposed connection between farming and pigmentation, I assigned a date for the appearance of farming around each sample locality, using archaeological domestication and crop evidence. Farming duration is the interval from that assigned date to the person’s date, with zero for people who lived before local farming. Figure 1 shows the localities and their assigned chronologies. Betti et al. 2020
The expanded analysis retains 6,643 European genotype records from 92 verified studies, dated from the present back to 18,000 BP. It includes 527 records predating assigned local farming. Years BP enters the model alongside farming duration, so the farming coefficient is estimated after accounting for the general chronological trend.
Figure 1. Sample locations and local farming history
The main model uses local UVB, the part of sunlight that starts vitamin D synthesis in the skin. UVB and latitude are strongly related, so I fit latitude in a separate sensitivity model. Both specifications include sample date, farming duration, longitude and study effects. The local glUV dataset measures erythemally weighted radiation: it is a geographical UVB proxy, rather than a direct measure of vitamin D production. Modern exposure at an ancient sample’s recorded location also carries uncertainty about prehistoric conditions.
I report two ways of accounting for shared background. Study-clustered regression allows samples from the same publication to share unexplained influences. A genetic relationship model also accounts for genome-wide similarity between samples, although it can absorb part of the ancestry turnover we want to understand. Its uncertainty calculation assumes the fitted relationship model is adequate.
In the UVB specification, farming duration has a standardized beta of +0.126 in study-clustered regression, with a 95% interval from +0.023 to +0.229 and p=0.022. The genetic relationship model gives +0.114, with an interval from +0.058 to +0.169 and p<0.001. A standardized beta describes the score change associated with one standard deviation of the predictor. Raw coefficients are about +0.058 and +0.053 score SD per additional thousand years of local farming (Table 1).
Table 1. Panel A: Study clustered regression with UVB
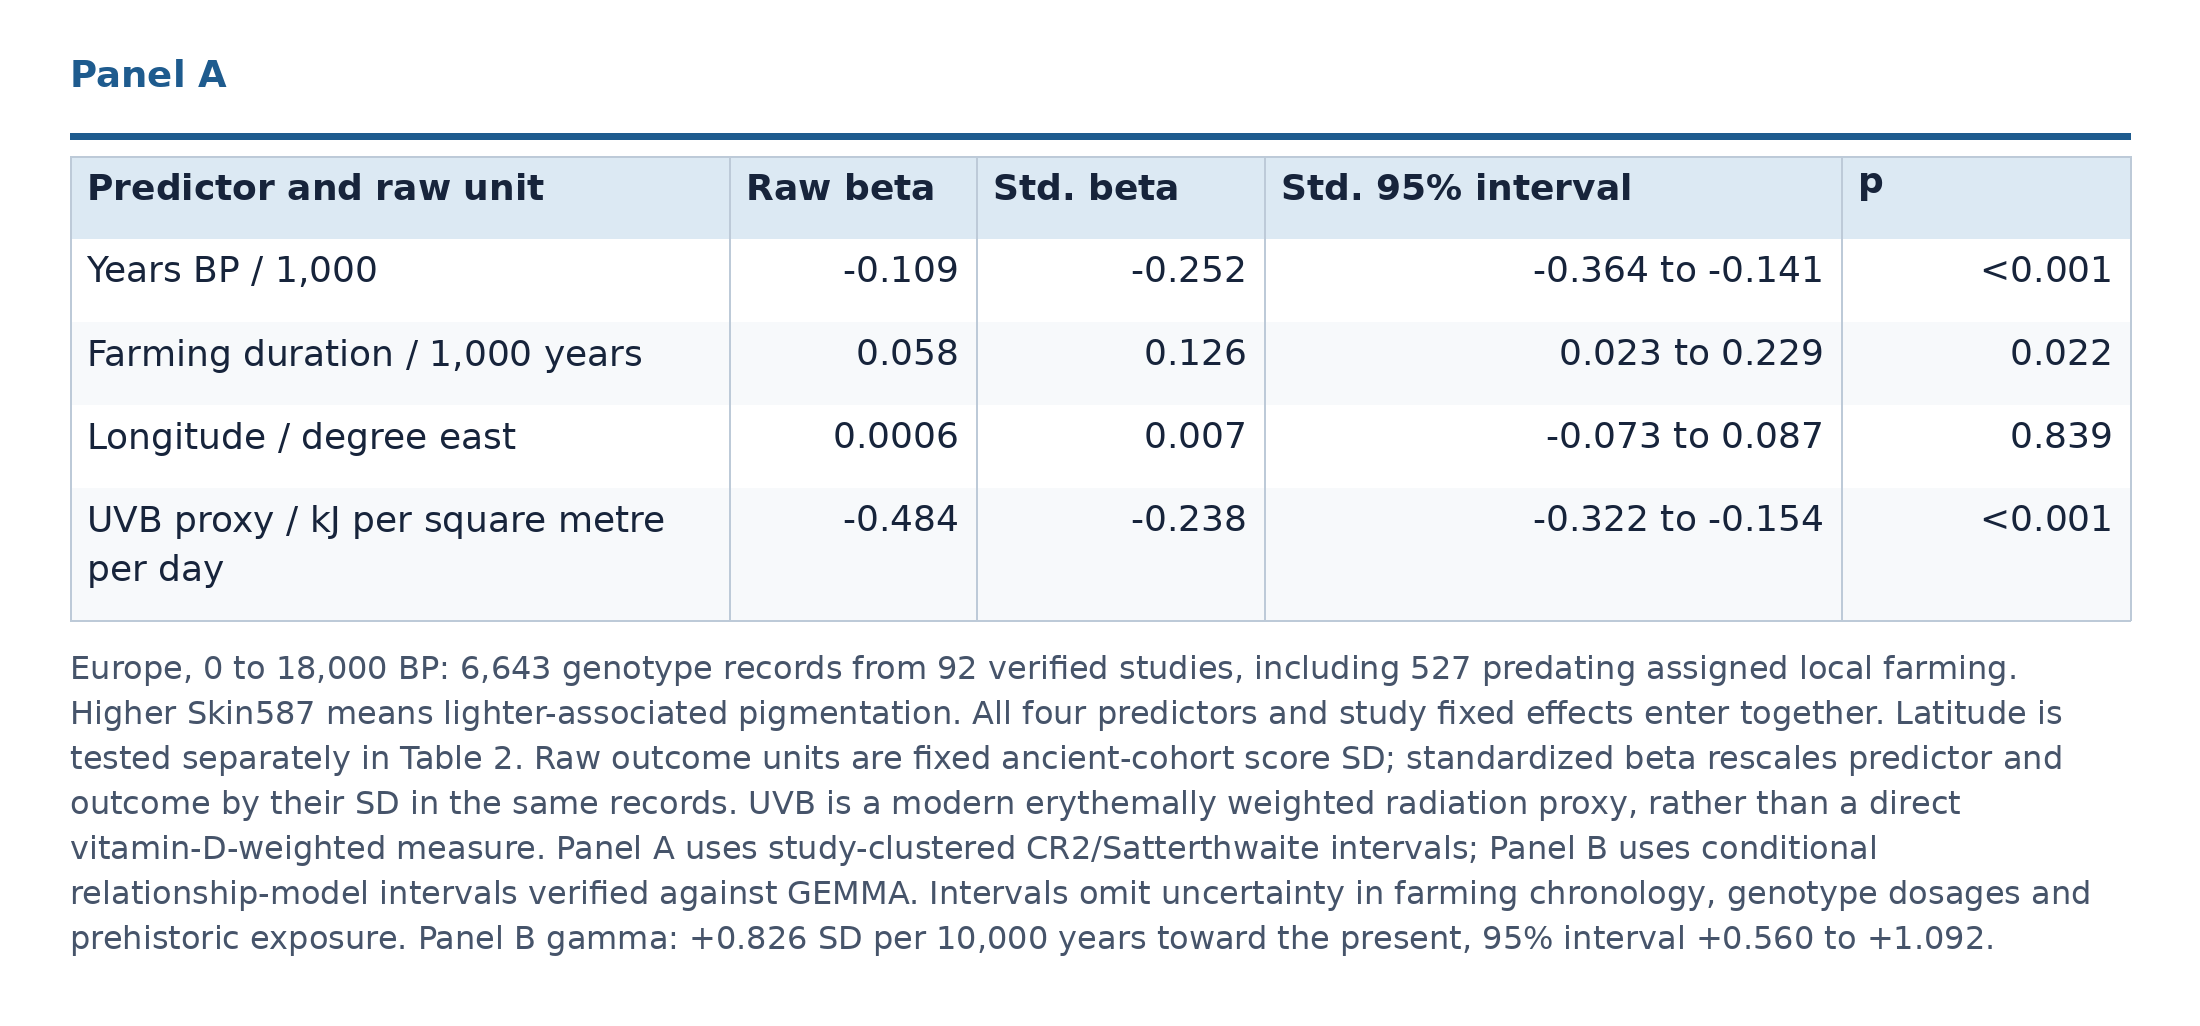
Table 1. Panel B: Genetic relationship model with UVB
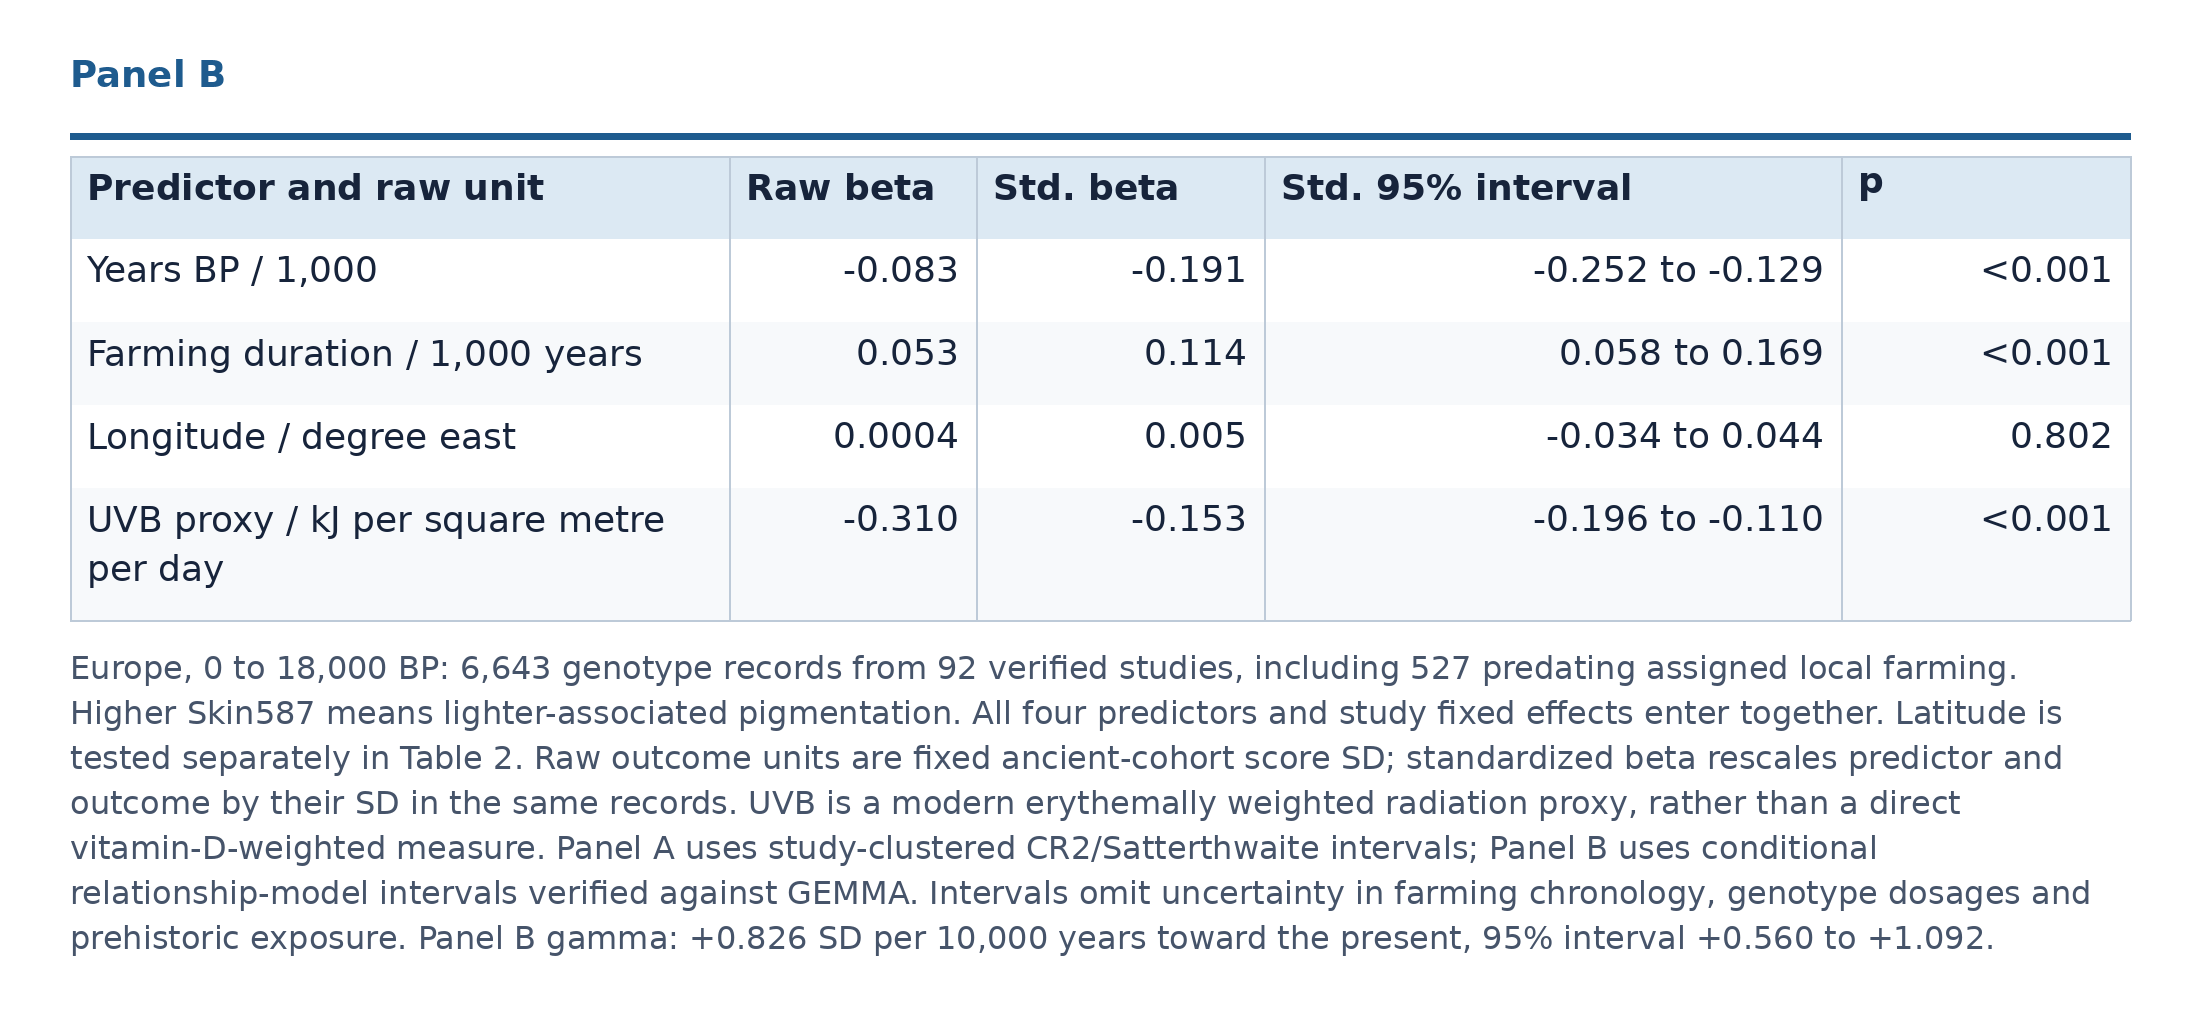
The UVB association is negative: a standardized beta of -0.238 in clustered regression (95% interval -0.322 to -0.154) and -0.153 in the relationship model (-0.196 to -0.110), with p<0.001 in both. Higher UVB is associated with a darker-directed score after the other adjustments; lower UVB is associated with a lighter-directed score (Table 1; Figure 2). This pattern is consistent with the vitamin D hypothesis described above. Vitamin D levels and individual dietary intake were not measured.
Figure 2. Farming duration and UVB associations
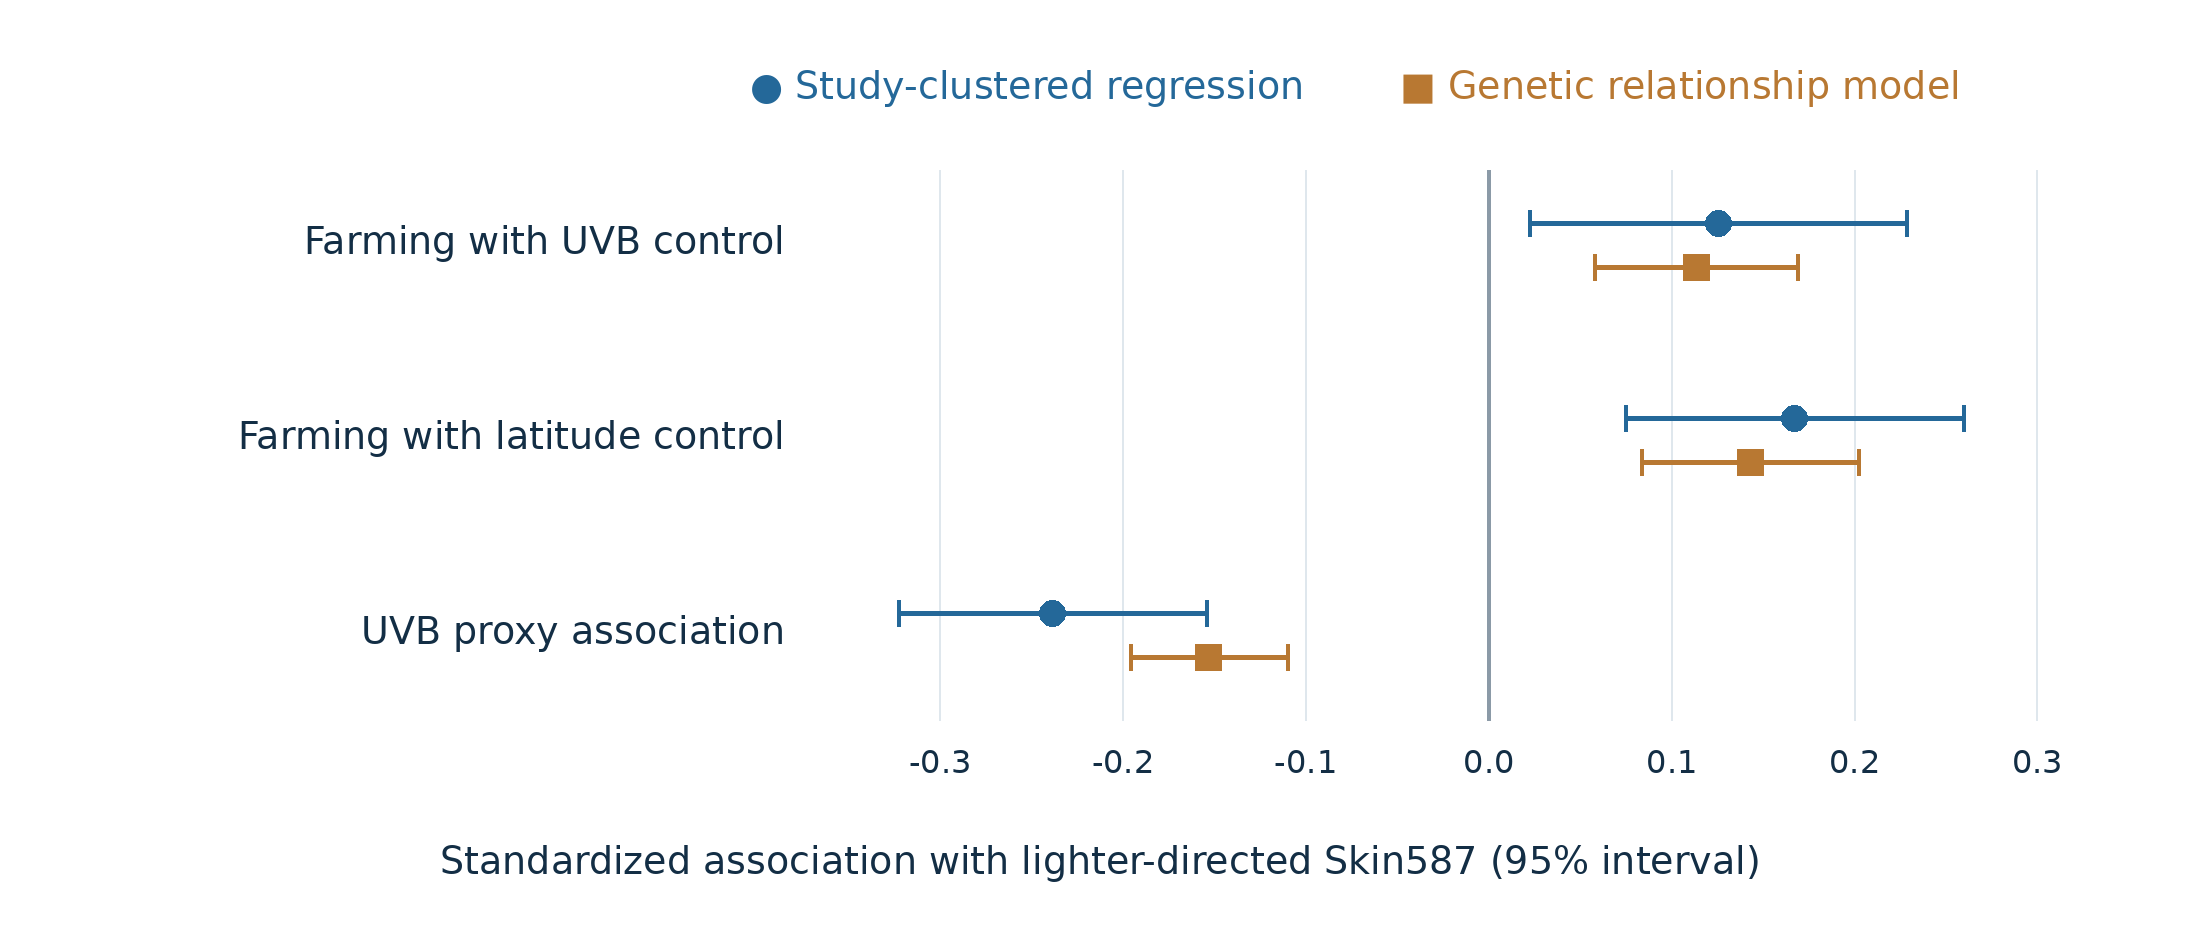
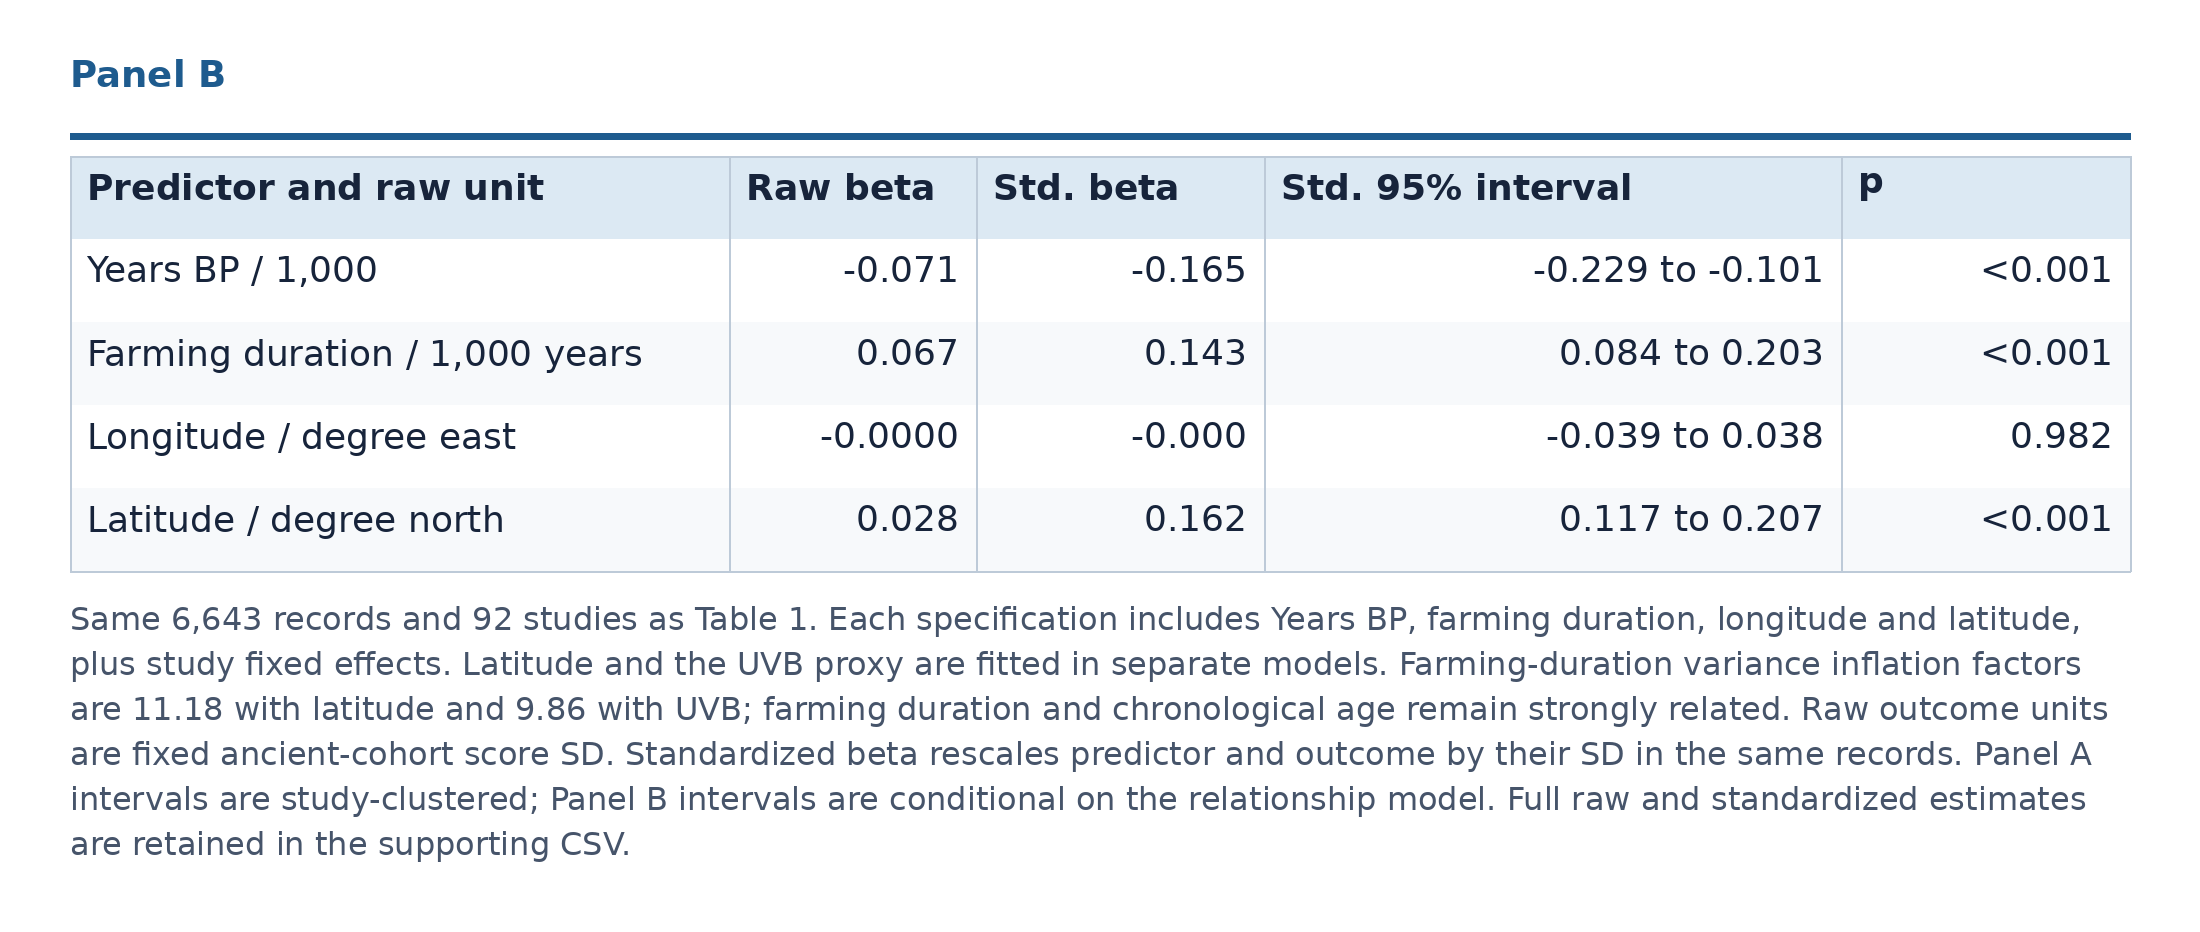
The farming association is stronger in the latitude-only sensitivity, with standardized betas of +0.167 and +0.143 in the clustered and relationship models (Table 2), compared with +0.126 and +0.114 under UVB control (Table 1). Farming duration remains strongly correlated with chronological age: its variance inflation factor is 11.18 with latitude and 9.86 with UVB. The data distinguish those effects imperfectly.
Table 2 provides every substantive predictor in the latitude sensitivity, including chronological age and longitude. Table 1 gives the corresponding UVB model. The supporting coefficient CSV retains the full raw and standardized estimates and their uncertainty.
Table 2. Panel A: Latitude sensitivity in clustered regression
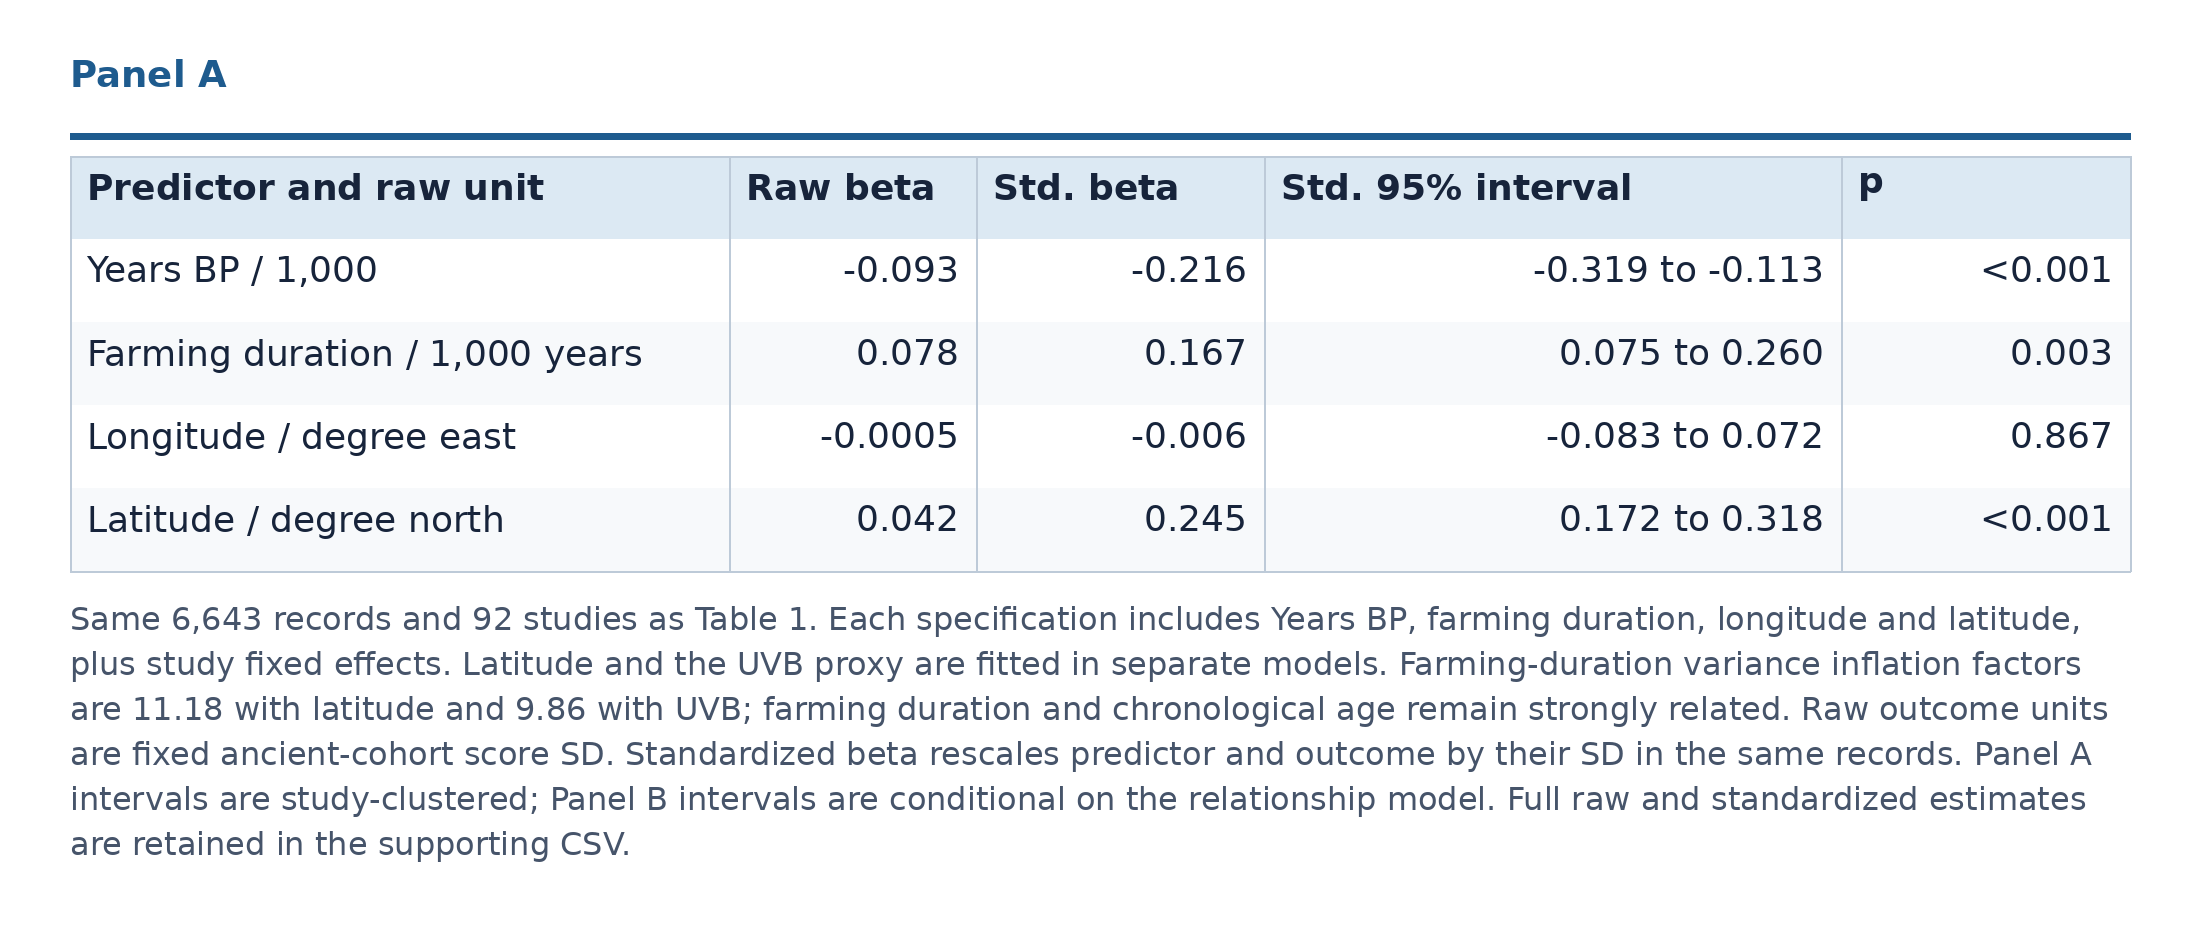
Table 2. Panel B: Latitude sensitivity in the relationship model
Longer local farming history is therefore associated with lighter-directed pigmentation scores under several specifications. The precise dietary interpretation remains uncertain. Migration, ancestry turnover, latitude, regional history and dating error can all influence that association. The genetic relationship model adjusts for genome-wide similarity, which can remove part of the historical ancestry signal as well as confounding. Its narrower intervals deserve comparison with the study-clustered results.
The farming and UV associations leave another part of the story to explain: which populations carried the light-associated alleles, and how those alleles spread. Below, I turn to the questions readers raised about the previous post:
Did Corded Ware get its light skin alleles from earlier European farmers, particularly the Globular Amphora culture?
Were those alleles already present in the eastern and Caucasus hunter-gatherer ancestors of the Yamnaya?
How did farmers in Spain compare with farmers in Sweden?
What do “intermediate” and “pale” mean relative to modern Europeans?
Can changes within steppe-derived chromosome segments tell us where light skin alleles came from?
How do light-associated variants in Sintashta and Andronovo fit a farming explanation?